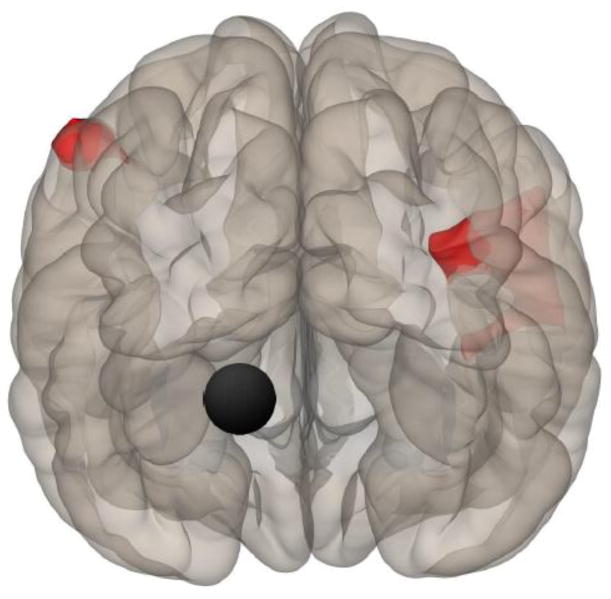
Figure 2.
Posterior view showing location of the left PaHCG (black circle) and clusters 1 (56, 6, 44) and 2 (−54, −30, 52), for which HC had higher connectivity than ME/CFS. Cluster 1 regions include right precentral gyrus, right middle frontal gyrus, and right inferior frontal gyrus (pars opercularis and pars triangularis). Cluster 2 regions include left postcentral gyrus and left supramarginal gyrus

