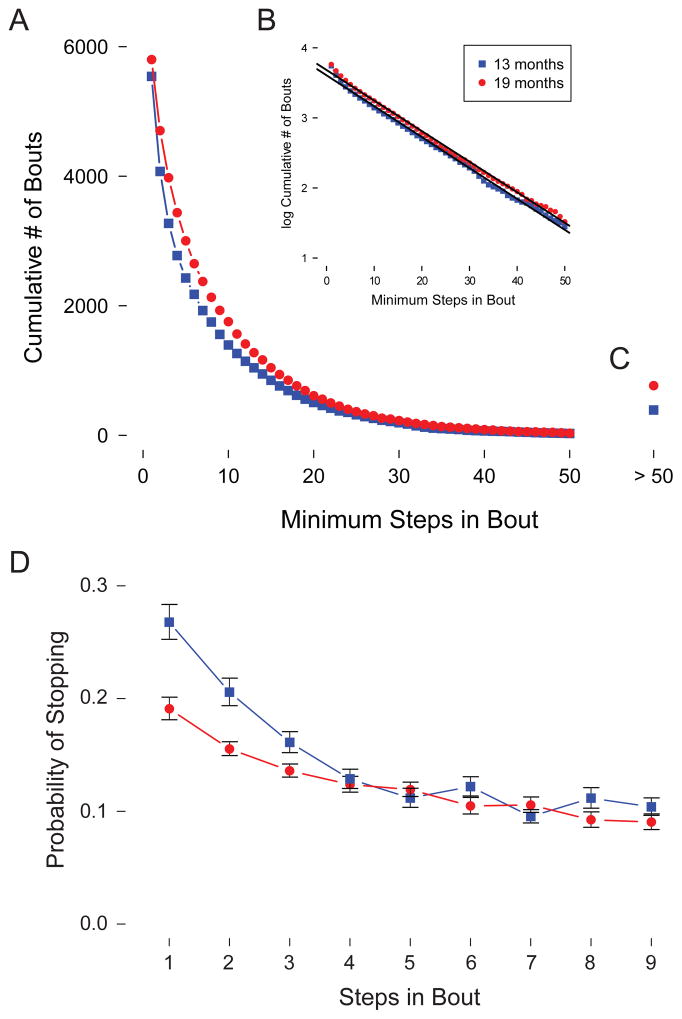
Figure 3.
(A) Cumulative survival distribution of steps per bout in 13-month-olds and 19-month-olds. (B) Semi-log plot of the same data. Black lines indicate the linear fit for each age group. (C) Total number of bouts containing more than 50 steps. (D) Probability of ending a bout after taking one to nine steps in 13-month-olds and 19-month-olds. Thirteen-month-olds are represented by blue squares, and 19-month-olds by red circles. Error bars represent the standard error of the mean.

