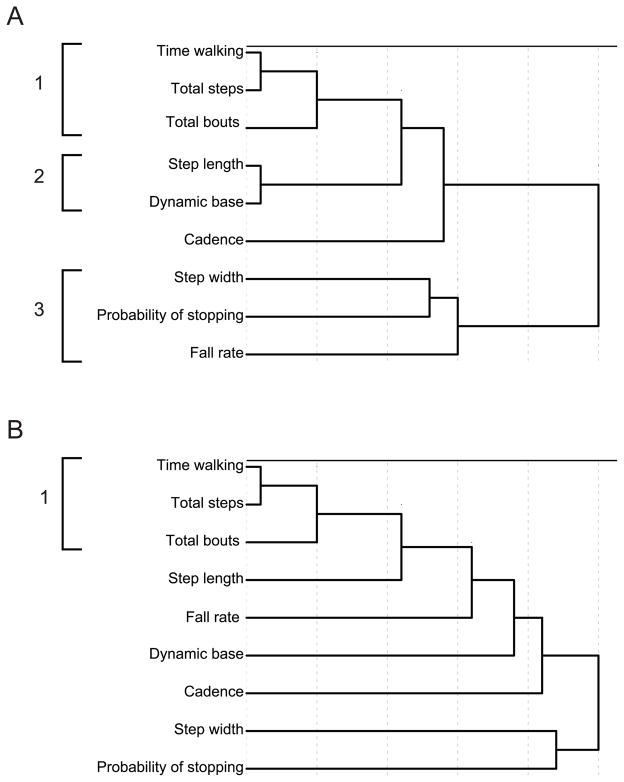
Figure 7.
Dendrograms illustrating the results of cluster analyses for (A) 13-month-olds and (B) 19-month-olds. Variables that join early in the procedure (further to the left) are more closely related than variables that join late in the procedure (further to the right). Resulting clusters are highlighted by the brackets on the left side.

