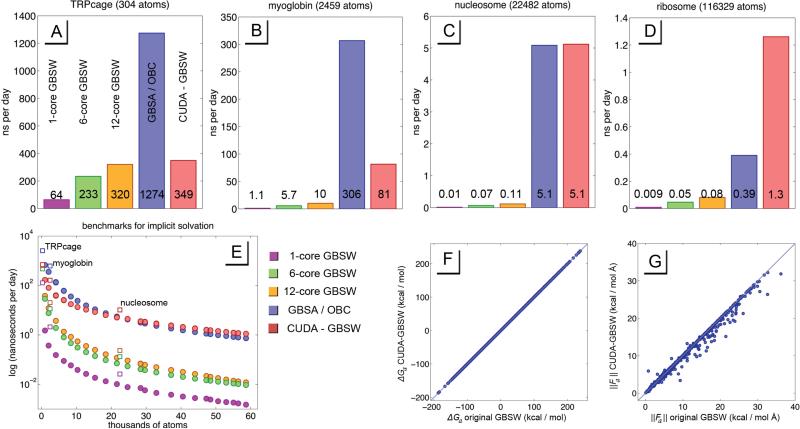
Figure 6.
Above in plots A-D are benchmarks for specific systems in nanoseconds per day, which include benchmarks for the original CHARMM algorithm with 1, 6, and 12 cores (purple, green and yellow respectively), a benchmark for the GBSA / OBC algorithm running in OpenMM (blue), and the CUDA-GBSW algorithm discussed in this study (red). Plot E shows a logarithmic benchmark for various system sizes, all of which are comprised of one or more proteins from the small eukaryotic ribosomal subunit. The result is a smooth curve highlighting what system sizes receive what speed gains for various systems. The square icons represent benchmarks for the specific systems in plots A-D. These systems were TRPcage, myoglobin, nucleosome, and the small eukaryotic ribosomal subunit, with PDB codes 1L2Y, 1BVC, 1AOI, and 4V88 respectively. Plots F and G show the accuracy of CUDA-GBSW in recapitulating the forces and energies of the original GBSW algorithm in CHARMM.

