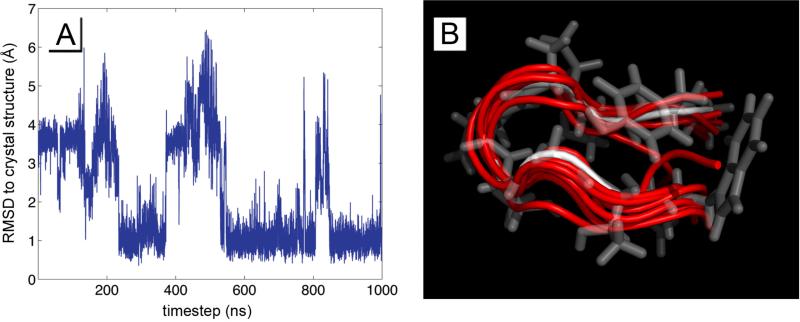
Figure 7.
Chignolin was simulated in 8 replicas for 1 microsecond, and each trajectory was analyzed by RMSD to the PDB crystal structure 1UAO by backbone carbon atoms, and through an unbiased k-means clustering algorithm. A) shows a typical RMDS trajectory of comparing chignolin to the crystal structure, and B) overlays the dominant configurations from the k-means clustering (red) with the structure from 1UAO (white and transparent).

