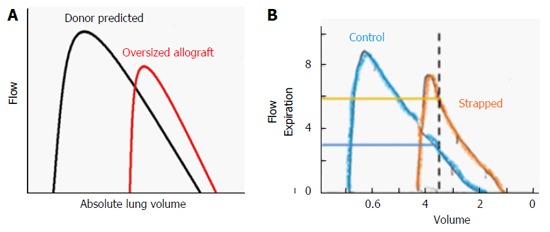
Figure 5.

Oversized allograft (A) and chest wall strapping (B) analogy. A: Schematic flow volume loops according to donor predicted values (black line) and measured mean values of recipients of oversized allografts (red line) during the early post-transplant period (1-6 mo). Flows are plotted against absolute lung volume; B: Control (blue) and chest wall strapped (orange) flow volume loops are shown. Adapted with permission from Eberlein et al[5,28].
