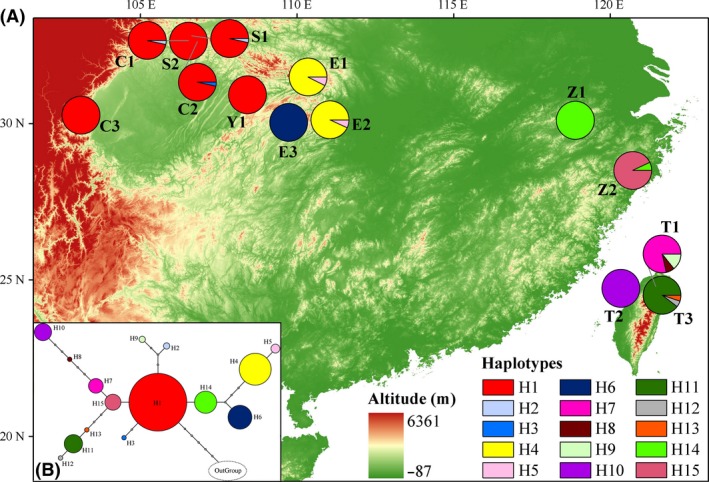
Figure 1.

(A) Distribution of 15 haplotypes of Fagus hayatae and (B) their statistical parsimony network with “OutGroup” (Fagus lucida). The size of each colored circle is proportional to the relative haplotype frequency and the haplotype colors correspond to those shown in (A), while solid lines represent nucleotide site differences between haplotypes.
