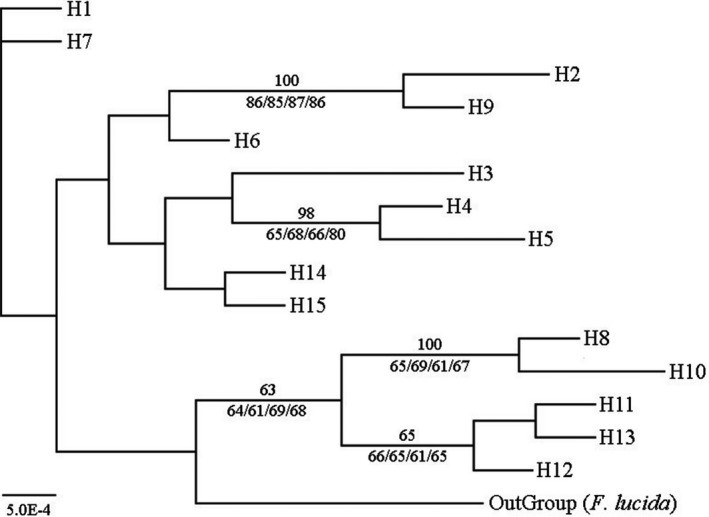
Figure 3.

Bayesian phylogenetic tree of 15 haplotypes with “OutGroup” (Fagus lucida). Values above branches corresponding to posterior probabilities (%) and only those over 50% are shown. Values below branches correspond to bootstrap supports (%) of the nodes resulting from ML with Akaike information criterion, ML with Bayesian information criterion, MP and NJ phylogenetic inferences, and only those over 50% are shown.
