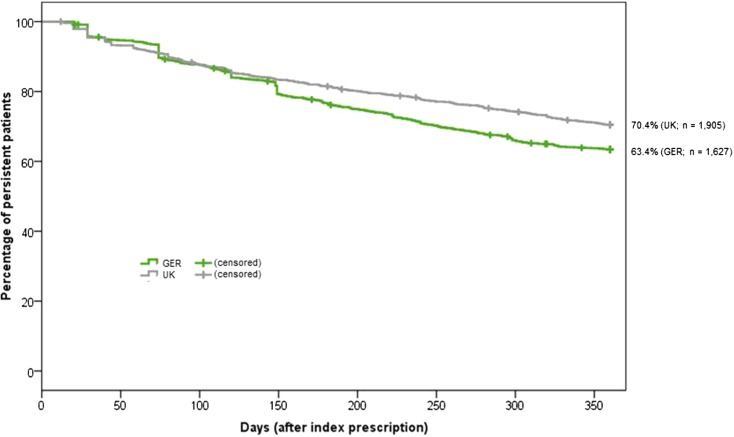
Fig. 2.
Kaplan–Meier curves for percentage of T2DM patients persistent to their therapy with GLP-1 receptor agonists. The figure describes percentage of T2DM still persistent (no gap >90 days) to their therapy with GLP-1 receptor agonists over time (12 months) with regards to UK-T2DM and GER-T2DM patients having started a therapy with GLP-1 receptor agonists. T2DM type 2 diabetes mellitus, GLP-1 glucagon-like peptide-1, UK United Kingdom, GER Germany

