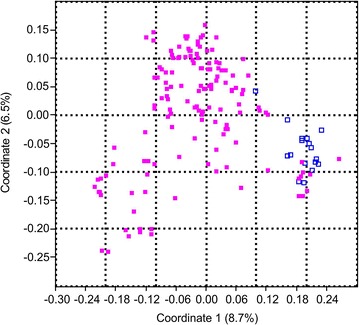
Fig. 1.

Principal coordinate analysis of the 161 genotypes based on Jaccard distances. Percentages in parentheses refer to the proportion of variance explained by the principal coordinate. Violet filled square states for winter forms; Blue ones reflect spring forms. Coordinate 1 explained 8.7 %, and Coordinate 2 explained 6.5 % of the total genetic variation
