
Figure 3.
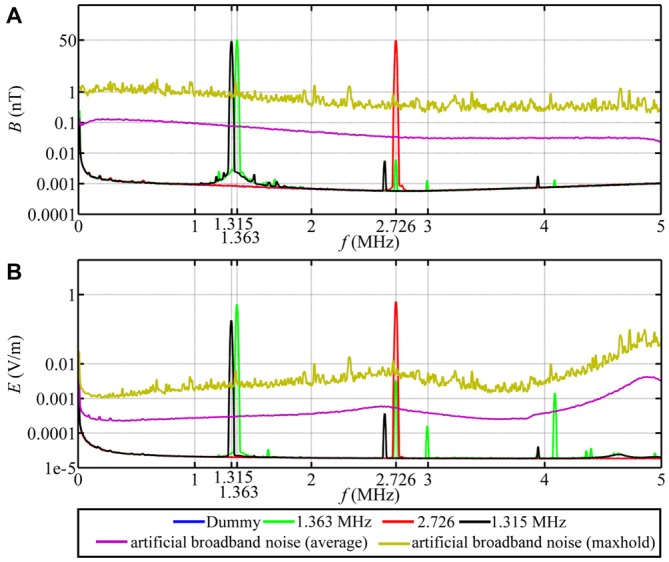
Magnetic and electric field measurements of test conditions in spring 2012, autumn 2013 and spring 2014. Traces in (A,B) show, respectively, the magnetic (B) and electric (E) components of the narrow-band electromagnetic fields and the artificial broadband noise as a function of frequency (f). The narrow-band magnetic fields had a peak intensity of 48 nT. The intensity of the broadband noise is shown twice: the purple line is the average (root mean square) intensity and the yellow line is the 40 min max-hold intensity and is directly comparable to the spectra shown in Engels et al. (2014).