Figure 1.
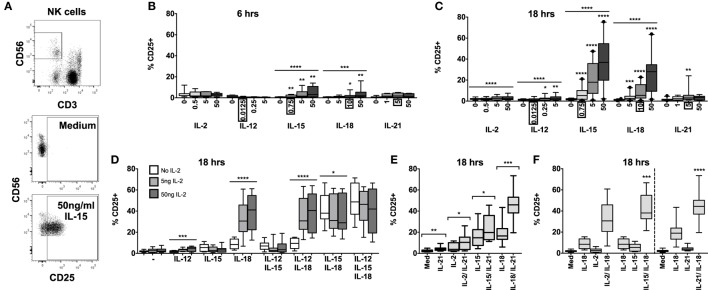
IL-18 and IL-15 both independently drive CD25 but interact differently with IL-2. PBMCs were stimulated for 6 or 18 h in vitro and upregulation of NK cell surface expression of CD25 was measured in response to Med (medium alone), IL-2, IL-12, IL-15, IL-18, or IL-21. Representative flow cytometry plots show gating of CD3−CD56+ NK cells and surface expression of CD25 on unstimulated and IL-15-stimulated NK cells (50 ng/ml) (A). CD25 expression on NK cells was measured after stimulation with Med, IL-2, IL-12, IL-15, IL-18, or IL-21 (concentrations in nanograms per milliliter as labeled) for 6 h (B) or 18 h (C) (n = 6–22, data from two to three experiments). Concentrations in boxes indicate those used in following graphs. CD25 expression on NK cells was also measured after stimulation with a titration of IL-2 (0, 5, and 50 ng/ml) in combination with IL-12 (12.5 pg/ml), IL-15 (0.75 ng/ml), and/or IL-18 (10 ng/ml) for 18 h (D) (n = 7–8, data from two experiments). CD25 expression on NK cells was also measured following stimulation with 5 ng/ml IL-21 in combination with 5 ng/ml IL-2, 0.75 ng/ml IL-15, or 10 ng/ml IL-18 after 18 h (E) (n = 8, data from one experiment). CD25 expression after stimulation for 18 h with a combination of IL-18 (10 ng/ml) and γc cytokines was summarized to facilitate comparison between IL-2 (5 ng/ml), IL-15 [0.75 ng/ml; both from (D)], and IL-21 [5 ng/ml; from (E)] (F) (n = 7–8, data from one to two experiments). Box plots show the 5th to 95th percentile range. Data were analyzed using paired Wilcoxon signed-rank tests [(B,C,F) no lines; lowest concentration compared to Med, (E) capped lines; IL-2/IL-18 and IL-15/IL-18 compared to IL-18 alone, (F)] or ANOVA tests for linear trend for trend analysis across increasing cytokine concentrations including Med [(B–D), uncapped lines]. ****p < 0.0001, ***p < 0.001, **p < 0.01, *p < 0.05.

