Figure 2.

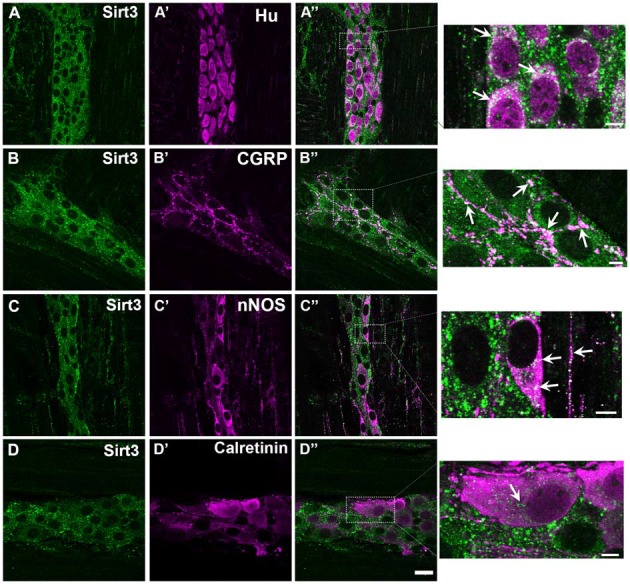
Myenteric neurons in the mouse colon express Sirt3. Panels show confocal fluorescence microscopy images of dual-label immunohistochemistry for Sirt3 (green, A–D) and either the neuronal marker HuC/D (magenta, A’), calcitonin gene-related peptide (CGRP; magenta, B’), nNOS (magenta, C’) or calretinin (magenta, D’). Overlays of each combination are shown in (A”–D”). The areas demarcated by the dashed boxes in the overlay images are shown as enlarged images in the panels at far right. Arrows in these images highlight several regions of co-localization. The scale bar in D” = 20 μm and applies to (A–D”). All scale bars in the enlarged images at right = 5 μm. Labeling is representative of experiments performed on tissue from a minimum of three mice.
