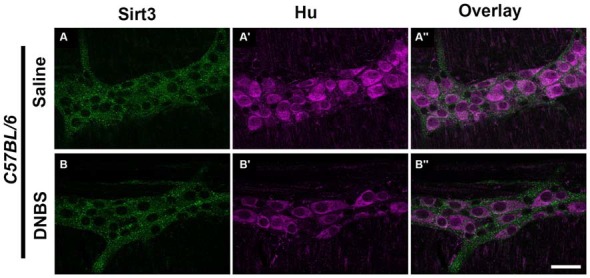
Figure 5.

Sirt3 expression in healthy and inflamed C57BL/6 mice. Panels show confocal fluorescence microscopy images of dual-label immunohistochemistry for Sirt3 (green, A,B) and the neuronal marker HuC/D (magenta, A’,B’). Overlays of each combination are shown in (A”,B”). The scale bar in panel B” = 50 μm and applies to (A–B”). Labeling is representative of experiments performed on tissue from a minimum of four mice.
