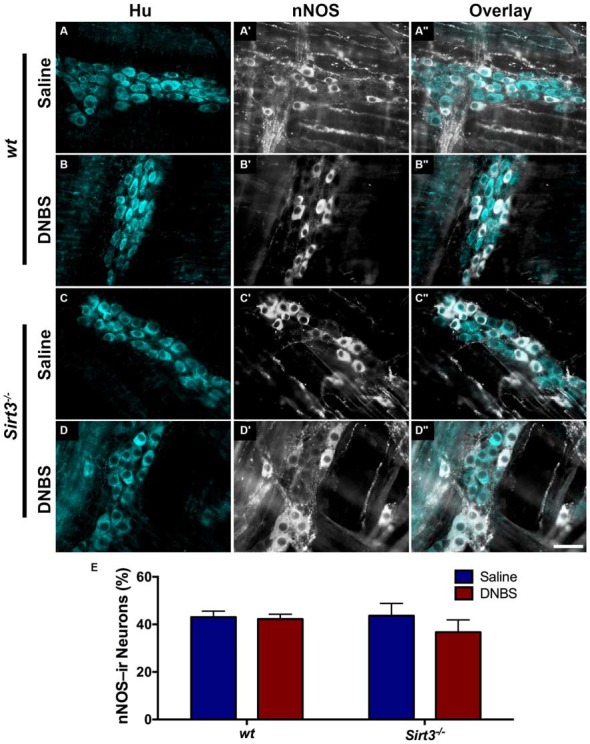
Figure 8.

The percentage of myenteric neurons that express nNOS is not altered by DNBS-colitis in wt or Sirt3−/− mice. (A–D”) show dual-label fluorescence immunohistochemistry for HuC/D (cyan, A–D) and nNOS (grayscale, A’–D’) in myenteric ganglia from saline- (A–A”,C–C”) or DNBS-treated (B–B”,D–D”) mice. Overlays are shown in (A”–D”). Scale bar in D” = 50 μm and applies to all images. (E) Quantification of the percentage of HuC/D immunoreactive neurons that also display immunoreactivity for nNOS in healthy and inflamed mice with wt or Sirt3−/− genotypes (n = 4–5 animals per group, P > 0.05, 2-way ANOVA).
