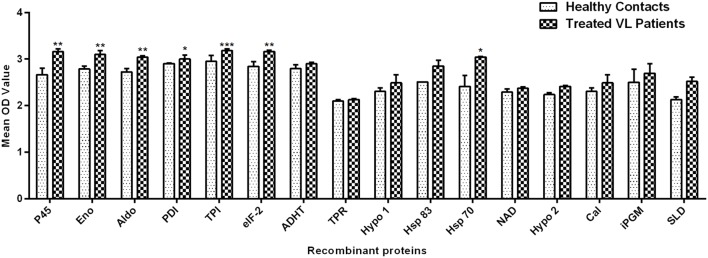
FIGURE 2.
Lymphoproliferative response in PBMCs of treated VL patients in response to 15 recombinant proteins and SLD (10 μg/ml each). Each bar represents the pooled data (mean ± SE). Significance values indicate the difference in stimulation between the SLD and the recombinant proteins (*p < 0.05, **p < 0.01, and ***p < 0.001).

