Figure 7.

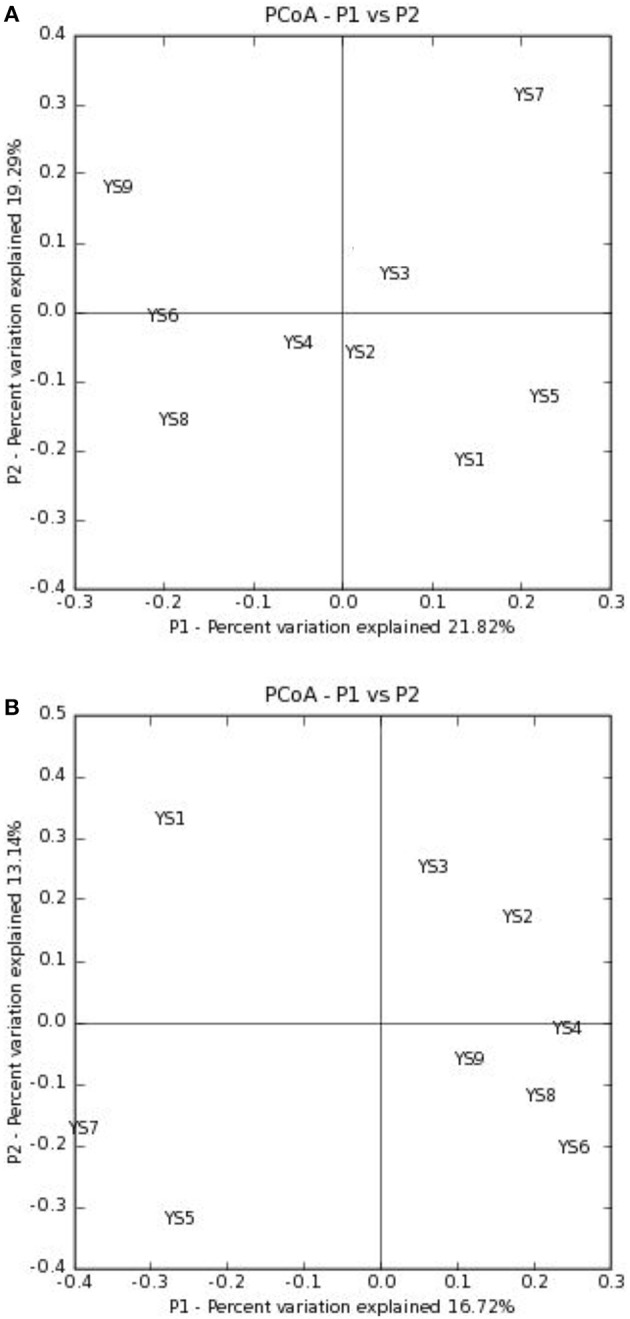
PCoA plots are presented of the first two axes based on (A) weighted and (B) unweighted Unifrac distance matrices showing the quantitative and qualitative clustering of samples.

PCoA plots are presented of the first two axes based on (A) weighted and (B) unweighted Unifrac distance matrices showing the quantitative and qualitative clustering of samples.