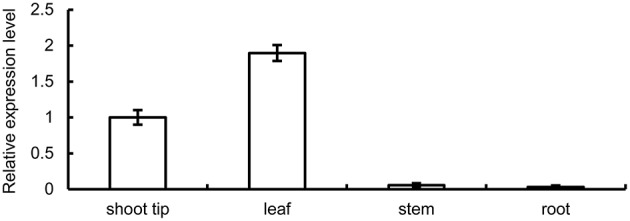
Figure 2.

Quantitative RT-PCR analysis of BpMYB106 relative expression level in different tissues of birch. Genes were normalized using 18S as housekeeping genes. Error bars on each symbol indicate the mean ± SE of three replicate reactions.

Quantitative RT-PCR analysis of BpMYB106 relative expression level in different tissues of birch. Genes were normalized using 18S as housekeeping genes. Error bars on each symbol indicate the mean ± SE of three replicate reactions.