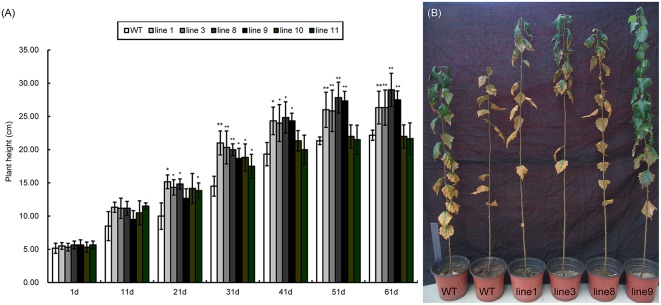
Figure 7.
Seedling heights of WT and transgenic lines (35S::BpMYB106). (A) Seedling heights of 35S::BpMYB106 transgenic lines compared with WT plant from day 1 to 61 under glasshouse conditions. Data accompanied by the same letter indicates no significant difference, and different letters indicate a significant difference (n = 15, *P < 0.05, **P < 0.01 by two-tailed t-test and one-way ANOVA). Error bars on each symbol indicate the mean ± SE of three replicate reactions. (B) 35S::BpMYB106 transgenic lines to the right of the image shown after 8 months of growth, as compared with two WT plants on the left. WT, wild-type plant; lines 1, 3, 8, 9, 10, and 11; transgenic lines (35S::BpMYB106).

