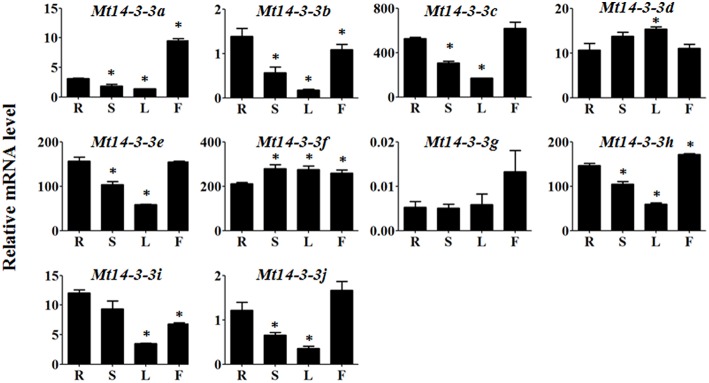
Figure 4.
Expression patterns of Mt14-3-3 genes. Expression patterns of the Mt14-3-3 genes were analyzed in different tissues: R, root; S, shoot; L, leaf; and F, flower. The data are from three independent biological experiments, and error bars indicate standard deviations. The significant differences in expression level were calculated using Student's t test, and indicated with an asterisks (*), P < 0.05.

