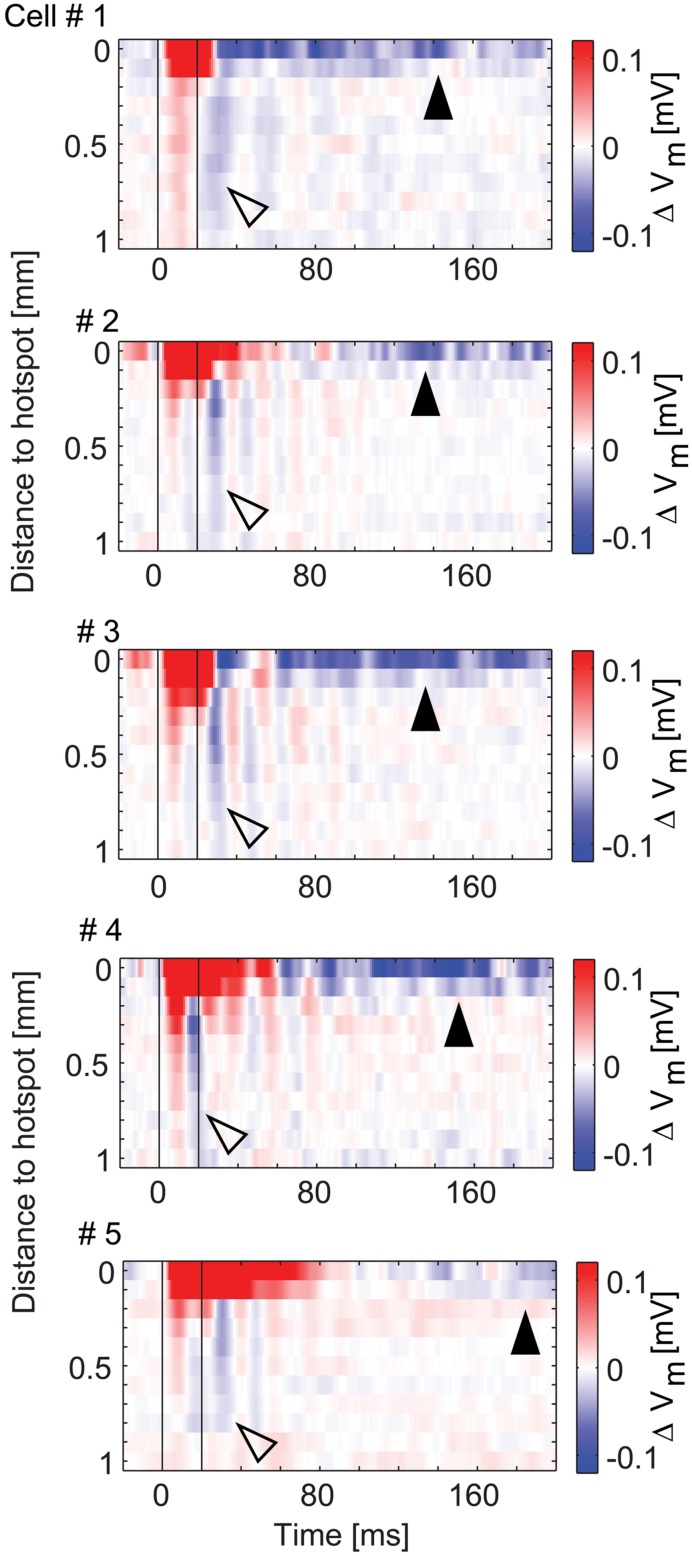
FIGURE 10.
Spatio-temporal profiles of excitatory and inhibitory effects. Color-coded membrane potential change as a function of distance from hotspot (100 μm bins) and time (1 ms bins) for the five MTCs with inhibition. Black lines, begin and end of stimulus. Arrowheads point to inhibitory effects at the hotspot (closed) and in the surrounding area (open).

