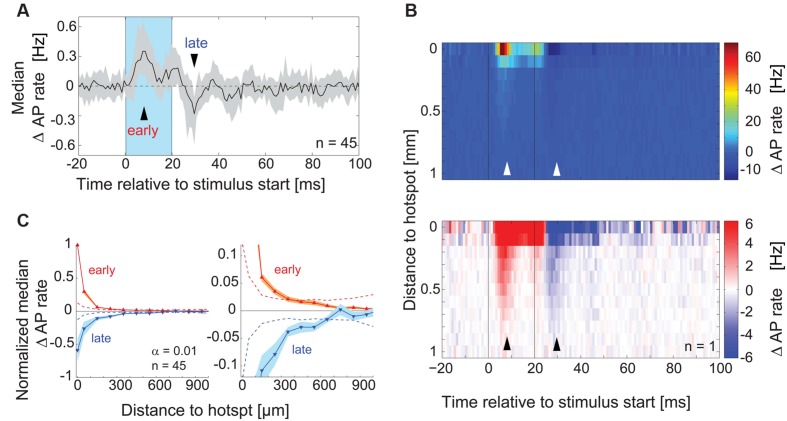
FIGURE 5.
Lateral inhibitory effects on AP rate. (A) For each MTC the median across PSTHs of all spots was calculated. The plot shows the median (black line) and interquartile range (gray area) of these median PSTHs across all MTCs (n = 45). Blue box, stimulus; arrowheads, time points of maximal AP rate increase and decrease respectively. (B) Color-coded average AP rate change as a function of time (x-axis, 1 ms bins) and distance from the hotspot (y-axis, 100 μm bins) of an individual experiment. Top, color map spanning the entire range of data; bottom, color map with increased contrast. Black lines, begin and end of the stimulus; arrowheads correspond to time points in (A). (C) Change of the AP rate at the time of maximal excitation ‘early’ (red trace, 9–12 ms post-stimulus start) and at the time of maximal inhibition ‘late’ (blue trace, 9–12 ms post-stimulus end) as a function of distance from the hotspot (100 μm bins). Data from each MTC were normalized to the values of maximal excitation and inhibition, respectively. Left panel, whole data range; right panel enlarged view. Solid lines, median of all 45 MTCs. Broken lines, significance levels (α = 0.01) calculated using shuffled data.

