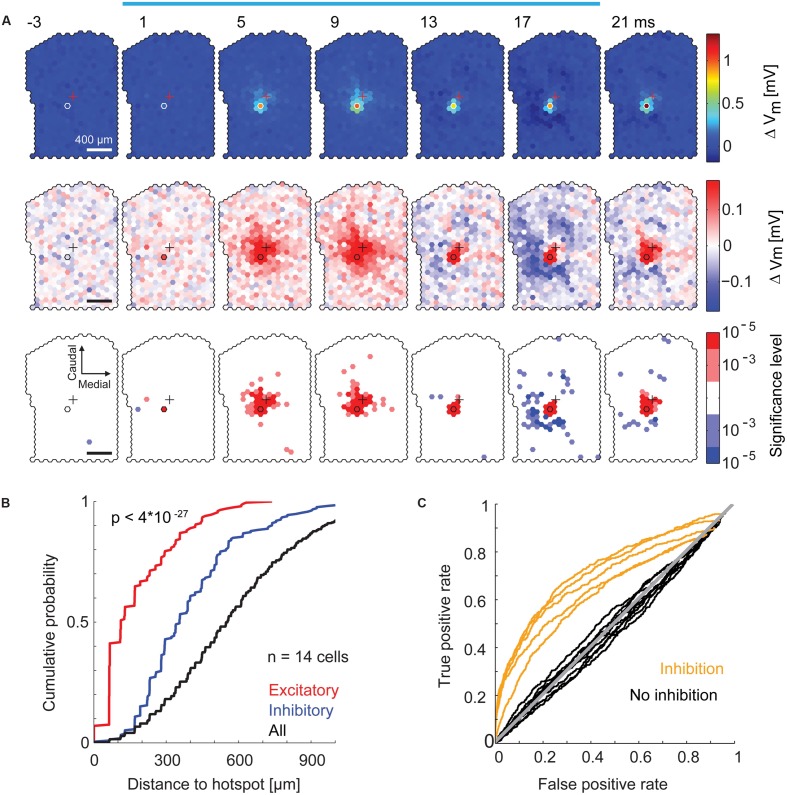
FIGURE 8.
Specific inhibitory effects on the membrane potential by surround stimulation. (A) Data from the same MTC as in Figure 7. Color-coded average membrane potential (4 ms time bins, 3,000 stimuli) for all spots. Start of the time bin is indicated in ms; blue bar, stimulus; outlined hexagons, hot spot; crosses, pipette tip position. The average membrane potential modulation (black trace in Figure 7B) was subtracted. Top, color map spanning the entire range of data. Middle, color map with increased contrast. Bottom, spots above (red) or below (blue) a significance threshold of α = 10-3 and α = 10-5 calculated using shuffled control data. Scale bar 400 μm. (B) Cumulative probability of the distance from the hotspot of significant excitatory spots (red, n = 199), significant inhibitory spots (blue, n = 212), and all spots (black, n = 6491) for all 14 MTCs. Significant spots occurring in multiple time bins (4 ms) were only counted once. (C) Receiver operator characteristics (ROC, see Materials and Methods) for detection of inhibitory spots (n = 14 MTCs). Curves of five MTCs (yellow) separated well from the diagonal (gray), ROC curves of the remaining nine MTCs (black) did not clearly separate from the diagonal.

