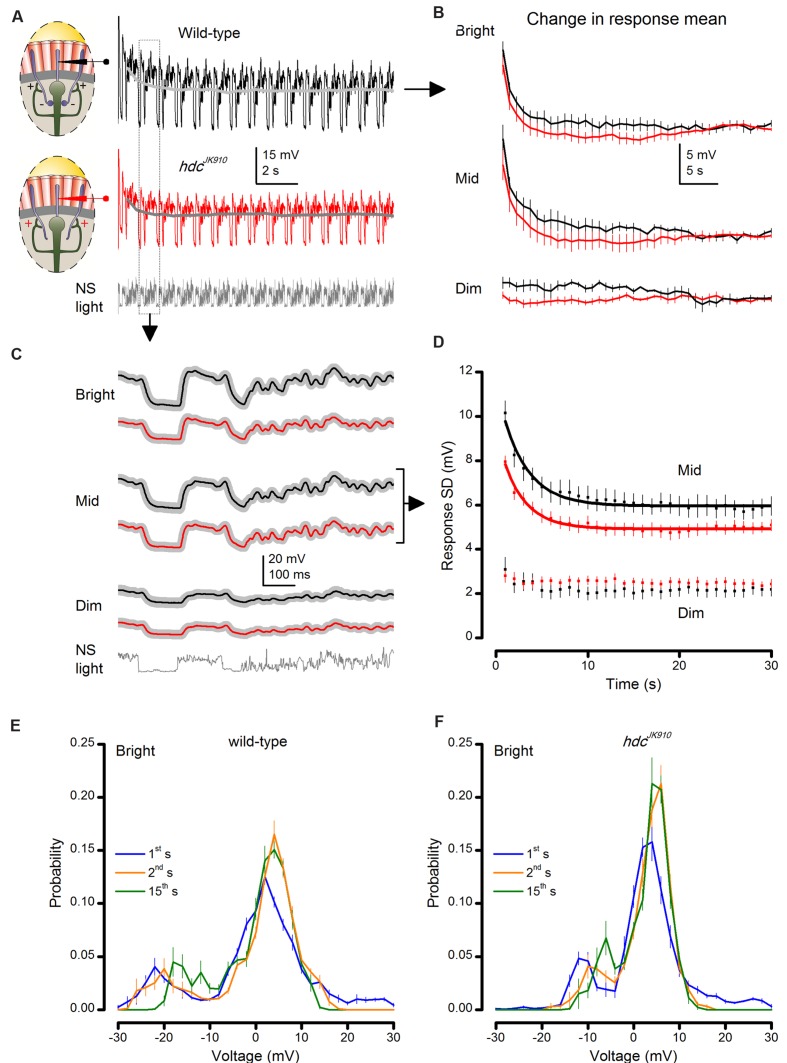
FIGURE 6.
hdcJK910 and wild-type photoreceptor outputs adapt to naturalistic stimulation with similar time courses. (A) Voltage responses of wild-type and hdcJK910 photoreceptors to repeated 1 s long bright naturalistic light intensity time series (NS). (B) Change in the mean of 1 s long response over 40 s of stimulation. Differences between mean wild-type and hdcJK910 responses were not statistically significant (p = 0.378 ± 0.035, 0.019 ≤p ≤ 0.949, across 60 time-bins, two-tailed t-test). (C) Average waveforms of steady-state adapted 1 s long voltage responses. (D) Change in response modulation (Standard Deviation of each 1 s long response) over 30 s of stimulation. Data for Mid light intensities are fitted with exponential curves: Twild-type = 2.83 ± 0.06 s, Thdc = 2.49 ± 0.07 s. (E) Probability Density Functions (PDFs) of wild-type photoreceptor output in the 1st, 2nd, and 15th s of Bright naturalistic stimulation. (F) PDFs of hdcJK910 photoreceptor output in the 1st, 2nd, and 15th s of Bright naturalistic stimulation. (B–F) Mean ± SEM, nwild-type = 7, nhdc = 8. All recordings performed at t = 19°C.

