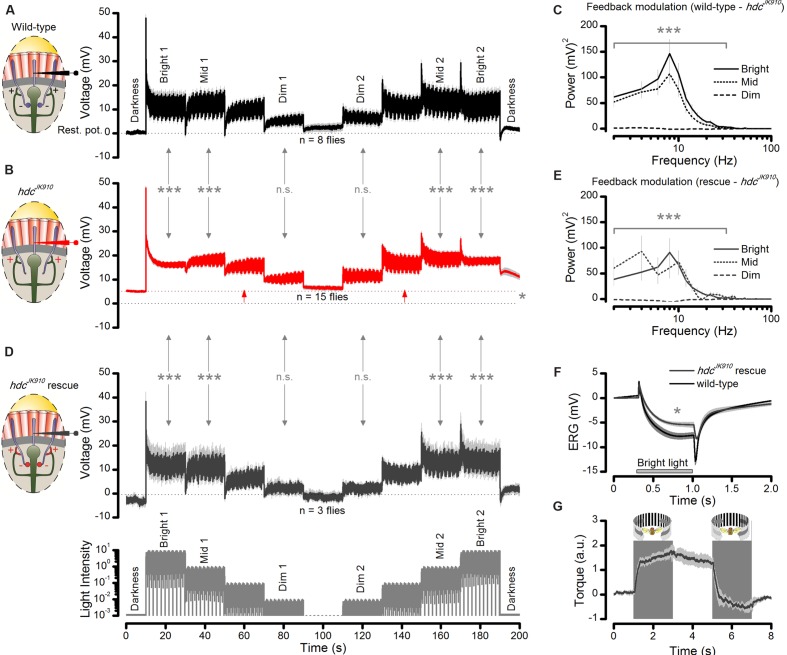
FIGURE 9.
Interneuron feedback accentuates modulation in R1–R6 photoreceptor output. (A) Voltage responses of wild-type photoreceptors to up- and down-stepped logarithmic naturalistic light changes show strong modulation during Bright, Mid and Dim intensities. Mean ± SEM, n = 8 cells. To ease comparison, zero ordinate marks the cell’s average resting potential in darkness. (B) hdcJK910 photoreceptors’ responses to the same stimulus exhibit reduced modulation during Bright and Mid intensities; Mean ± SEM shown, n = 15 cells. Testing hypotheses that mean wild-type modulation ≠ mean hdcJK910 modulation: Bright 1 (p = 1.785 × 10⁻⁸); Mid 1 (p = 3.357 × 10⁻⁷); Dim 1 (p = 0.676); Dim 2 (p = 0.292); Mid 2 (p = 9.447 × 10⁻⁹); Bright 2 (p = 6.416 × 10⁻¹⁰). On average, the cell’s resting potential was 5.3 mV higher than in the wild-type (red arrows between dotted lines, p = 0.013, one-tailed t-test). (C) The difference in the corresponding wild-type (normal feedback) and hdcJK910 (only tonic feedback) response power spectra suggests that the normal interneuron feedback accentuates R1–R6 output, phasically modulating it over 2–44 Hz frequency range during Mid and Bright stimulation. The corresponding wild-type power spectra (feedback modulation) differed from the hdcJK910 power spectra during Bright 1: 1–36 Hz (4.661 × 10⁻⁷ < p < 0.01) and 36–44 Hz (0.019 < p < 0.05) and Mid 1 stimuli: 1–18 Hz (1.051 × 10⁻⁶ < p < 0.015). (D) Histamine uptake rescues modulation in R1–R6 photoreceptor output in hdcJK910 mutants to wild-type levels; Mean ± SEM shown, n = 3 cells. Testing hypotheses that mean hdcJK910 rescue modulation ≠ mean hdcJK910 modulation in Bright 1 (p = 9.966 × 10⁻⁷); Mid 1 (p = 1.593 × 10⁻⁴); Dim 1 (p = 0.514); Dim 2 (p = 0.693); Mid 2 (p = 2.051 × 10⁻⁵); Bright 2 (p = 5.468 × 10⁻⁶). The rescued cells’ resting potentials differed from the non-rescued cells (p = 0.021) but not from the wild-type (p = 0.384). (E) Histamine-rescue recovers hdcJK910 photoreceptors’ output modulation power spectra to near wild-type levels; cf. (C). The rescued power spectra (with feedback modulation) differ from the hdcJK910 power spectra during Bright 1: 1–34 Hz (9.399 × 10⁻⁷ < p < 0.008) and 36 Hz (p = 0.0159) and Mid 1 stimuli: 1–14 Hz (8.425 × 10⁻⁶ < p < 0.005). (F) Histamine uptake rescues on- and off-transients in hdcJK910 ERG, indicating that the mutants see. For the given stimulus, the mutants fed on histamine, their ERG’s slow photoreceptor component differs from that of the mutants on normal diet (ERGPCrescue = 5.9 ± 1.7 mV, ERGPChdc = 3.6 ± 1.0 mV; mean ± SD, p = 0.006, nrescue = 4, nhdc = 7 flies). However, the rescued photoreceptor component still does not fully match the wild-type ERG (ERGPCwild-type = 8.2 ± 1.8 mV; mean ± SD, p = 0.034, nwild-type = 8 flies); cf. Figure 2B. (G) Histamine uptake rescues normal optomotor behavior in hdcJK910 mutants, as tested in the Drosophila flight simulator system to left and right rotating panoramic stripe patterns; cf. Figure 2C. The maximum optomotor responses of rescued hdcJK910 mutants are wild-type-like (ORrescue = 1.9 ± 0.2 a.u., ORwild-type = 2.0 ± 0.2 a.u., p = 0.715, nrescue = 5, nwild-type = 7 flies). (A–G) Mean ± SEM, two-tailed t-test, unless stated otherwise. (A,B,D): Modulation was the average standard deviation in each response segment, estimated from five consecutive 2 s samples: 11–20 s from each Bright, Mid, and Dim step onward. These averages for each corresponding Dim, Mid and Bright sections were collected across the tested fly populations and compared statistically.

