Figure 4.
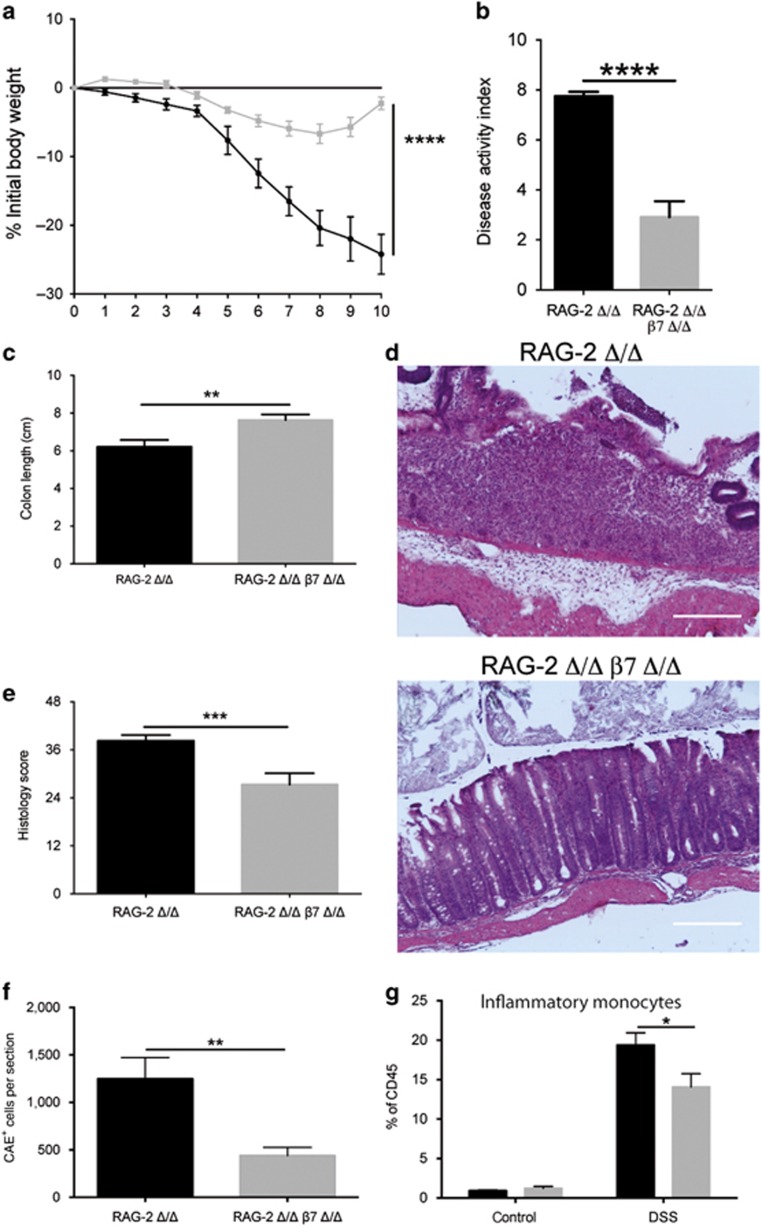
Loss of β7 integrin protects recombination activating gene-2-deficient (RAG-2 Δ/Δ) mice from acute dextran sodium sulfate (DSS)-induced colitis. (a) Percentage of body weight loss (measured daily over the course of DSS treatment), (b) disease activity index (DAI), and (c) Colon length (at day 10 of acute DSS colitis) of RAG-2 Δ/Δ (black squares, black bars, n=12) and RAG-2 Δ/Δ β7 integrin-deficient (β7Δ/Δ) (gray squares, gray bars, n=13) mice. (d) Representative photomicrographs of hematoxylin and eosin (H&E)-stained colon sections from the indicated groups at day 10 of acute DSS colitis at original magnification × 100 (bar represents 100 μm) and (e) results of histological scoring of sections from RAG-2 Δ/Δ (n=7) and RAG-2 Δ/Δ β7 integrin Δ/Δ (n=7) mice. (f) Quantification of CAE+ cells on sections from RAG-2 Δ/Δ (black bar, n=13) and RAG-2 Δ/Δ β7 integrin Δ/Δ (gray bar, n=11) mice at day 10 of acute DSS colitis. (g) Flow cytometric quantification of inflammatory monocytes (CD45+Ly6G−CD11b+F4/80+GR1+) in colon tissue of untreated and DSS-treated RAG-2 Δ/Δ (black bars, n=5 (untreated), 4 (DSS-treated)) and RAG-2 Δ/Δ β7 integrin Δ/Δ (gray bars, n=3 (untreated), 4 (DSS-treated)) mice at day 10 of acute DSS colitis. Gating was performed as illustrated in Figure 3. The data shown are representative of three independent experiments. Data represent mean±s.e.m. Statistical significance is indicated as follows: *P<0.05; **P<0.01; ***P<0.001; ****P<0.0001. (a–c, e, f) Two-tailed t-test. (g) Two-way analysis of variance (ANOVA) with Sidak's post-test.

