Figure 2.

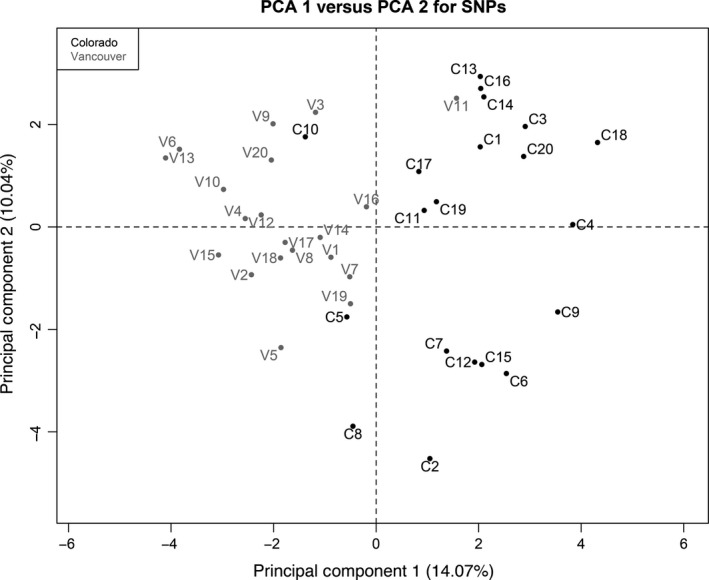
Principal component analysis conducted with 37 SNP markers. Each point represents an individual. Principal component 1 (14.07% of the variance) clearly differentiates the two populations.

Principal component analysis conducted with 37 SNP markers. Each point represents an individual. Principal component 1 (14.07% of the variance) clearly differentiates the two populations.