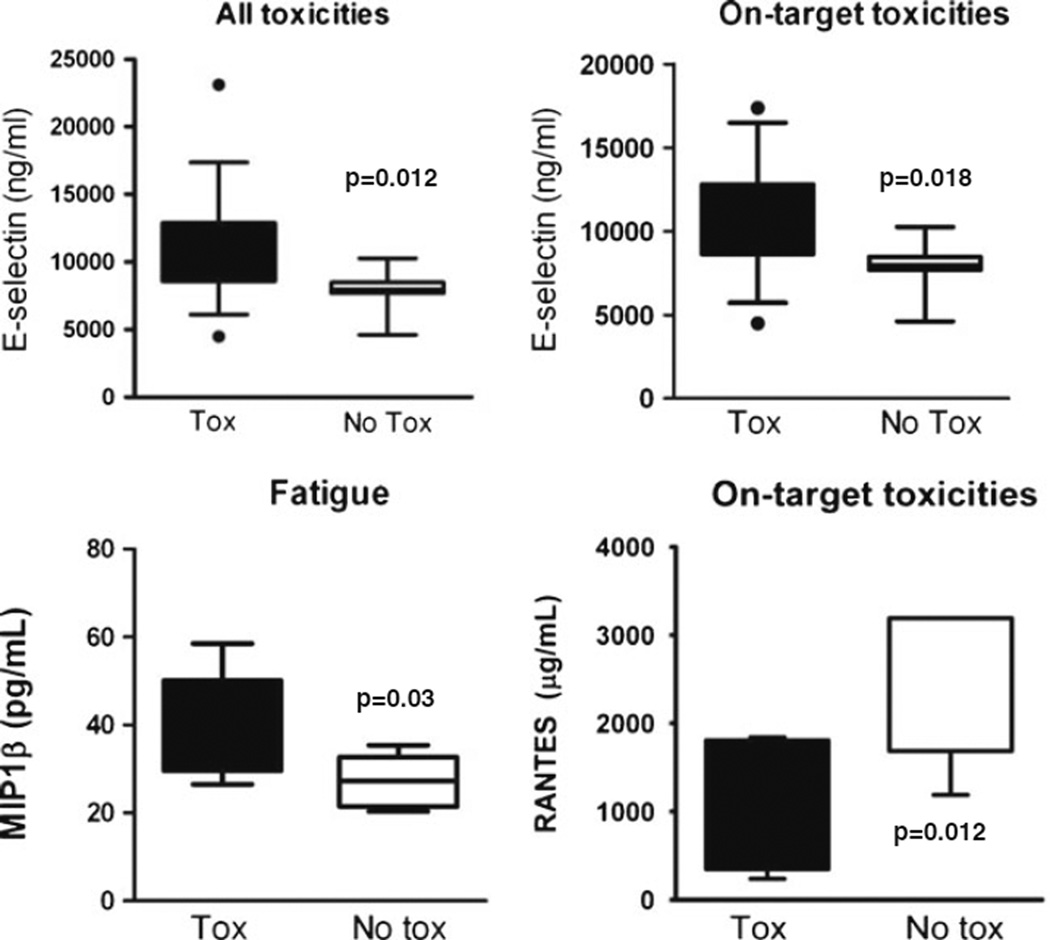
Fig. 2.
Baseline cytokines and angiogenic factors and toxicity (Tox) by category. Expression of individual cytokines at baseline for patients with and without the development of all toxicities, on-target toxicities, or fatigue during treatment with aflibercept. Box–whisker plots: horizontal line in the middle portion of the box, mean. Bottom and top boundaries of boxes, 25th and 75th percentiles, respectively. Lower and upper whiskers, 5th and 95th percentiles, respectively. Log-transformed baseline expressions were used and evaluated with Cox proportional hazard regression models to assess the effect of biomarkers on toxicity. All cytokines depicted were statistically significant, p<0.05 between the toxicity and notoxicity groups

