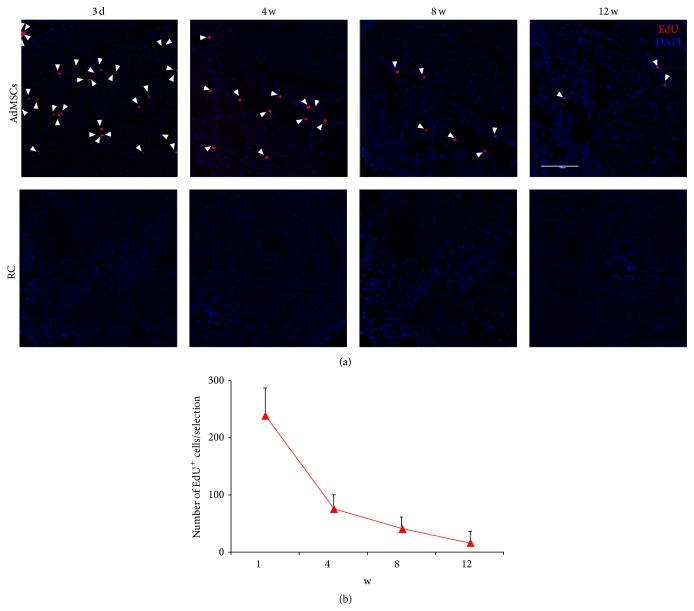
Figure 2.
Tracking of injected AdMSCs in bladder tissue. (a) Up: representative images of EdU positive cells within the bladder wall at different time points after cell injection. The white bar indicates 200 μm. Bottom: results of the number of EdU positive cells within the bladder wall at different time points after cell injection.

