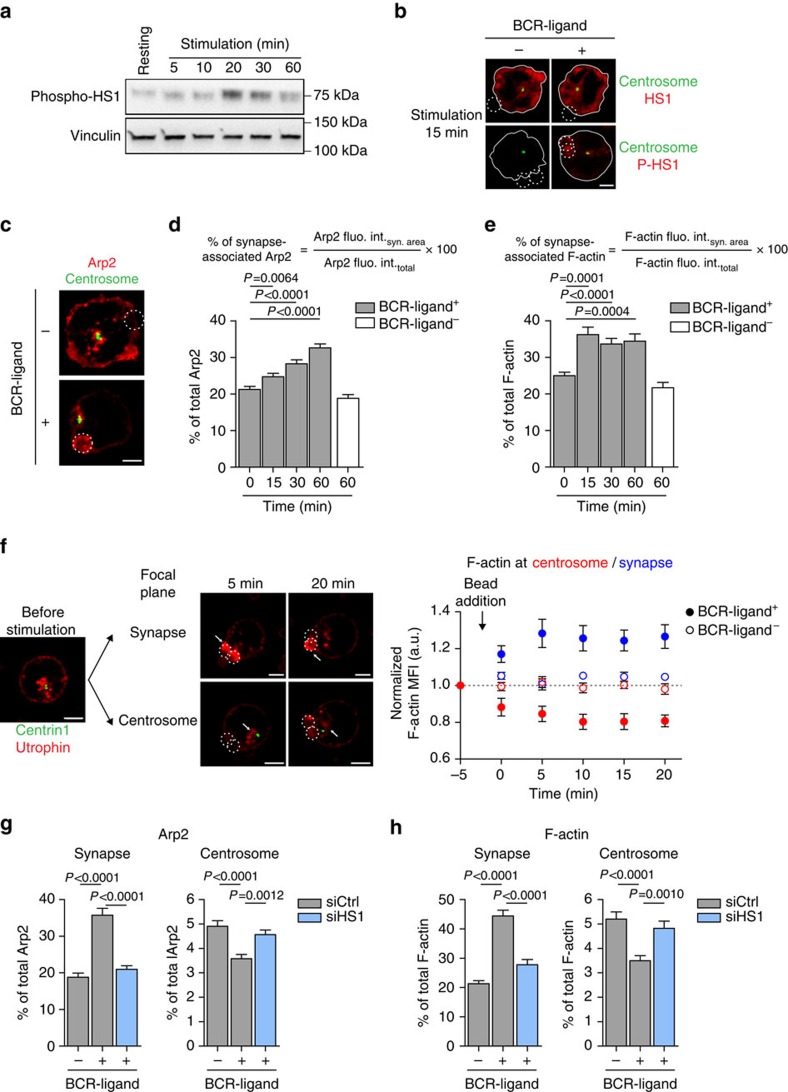
Figure 4. Depletion of Arp2/3 from the centrosome results from its HS1-dependent recruitment at the immune synapse.
(a) Western blot showing the phosphorylation of HS1 during the course of B-cell stimulation. Representative of two independent experiments. (b) Representative images of B cells stimulated with indicated beads for 15 min, fixed and co-stained for total HS1 (top) or phosphorylated HS1 (bottom) and the centrosome (α-tubulin). Dashed white circles indicate bead position. Scale bar, 3 μm. Images are representative of two independent experiments. (c) Representative images of B cells stimulated with indicated beads for 60 min, fixed and co-stained for Arp2 and the centrosome (α-tubulin). Dashed white circles indicate bead position. Scale bar, 3 μm. Representative of three independent experiments. (d,e) Quantification of synapse-associated Arp2 (d) and F-actin (e). (d) n=71, 64, 68, 72 and 69 cells and (e) n=55, 60, 66, 59 and 57 cells from left to right, pooled from three independent experiments. (f) Left: sequential images of B cells co-transfected with the centrosomal marker eGFP–Centrin1 and the F-actin probe Utrophin-RFP stimulated with BCR-ligand+ beads and imaged by time-lapse spinning disk microscopy. White arrows indicate F-actin clearance from the centrosome (bottom) and its concomitant accumulation at the immune synapse (top) during the course of B-cell stimulation. Dashed white circles indicate bead position. Scale bar, 3 μm. Right: quantification of synapse- (blue) and centrosome- (red) associated F-actin of B cells stimulated with indicated beads. F-actin mean fluorescence intensity (MFI) was normalized with respect to initial intensity (t−5 min) for each cell. Data are pooled from two independent experiments and graph shows the mean±s.e.m. of n=7 cells per condition. (g,h) Quantification of Arp2 (g) and F-actin (h) associated with the synapse (left) and the centrosome (right) in control and HS1-silenced B cells stimulated for 60 min with indicated beads. Data are pooled from two (g) and three (h) independent experiments with (g) synapse: n=51, 46 and 53 cells; centrosome: n=51, 52 and 47 cells; and (h) synapse: n=72, 74 and 66 cells; centrosome: n=73, 72 and 67 cells from left to right. P values determined by Mann–Whitney test. fluo. int., fluorescence intensity. syn, synapse.

