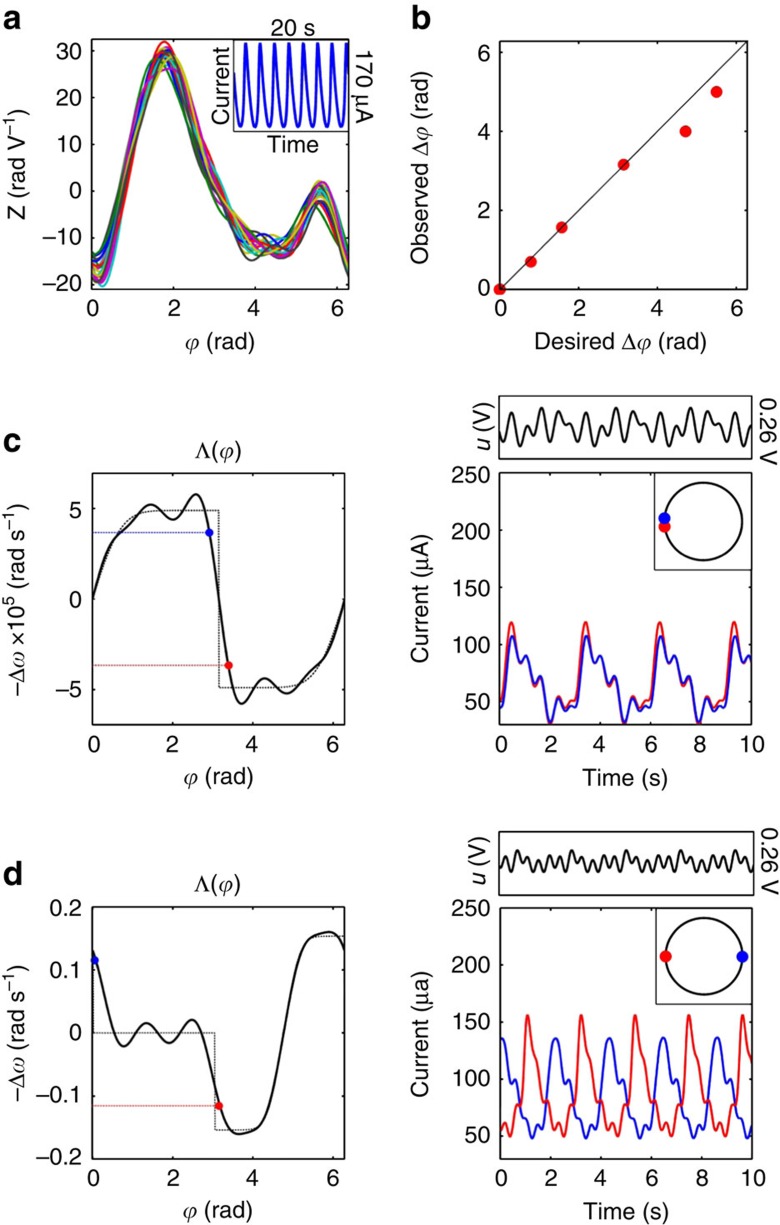
Figure 1. Tuning the phase difference between two electrochemical oscillators.
(a) PRCs measured simultaneously for 20 working electrodes, and observed current oscillations (inset). (b) Designed versus experimentally measured phase difference and fit (dotted line). The left panels in c and d show how phase assignment is constructed using an ideal interaction function (dotted line), and the respective best achievable approximation (solid line) for two nonidentical oscillators. The right panel shows the time-series of the entrained oscillators and the periodic control signal (above), and the entrained oscillator phases on the unit circle (inset). (c) In-phase phase assignment:  , with natural frequencies (ω1, ω2)=(0.330, 0.348) Hz shown in (blue,red) with Ω=0.339 Hz. (d) Anti-phase phase assignment:
  and natural frequencies (ω1, ω2)=(0.443, 0.480) Hz in (blue,red), with Ω=0.462 Hz.

