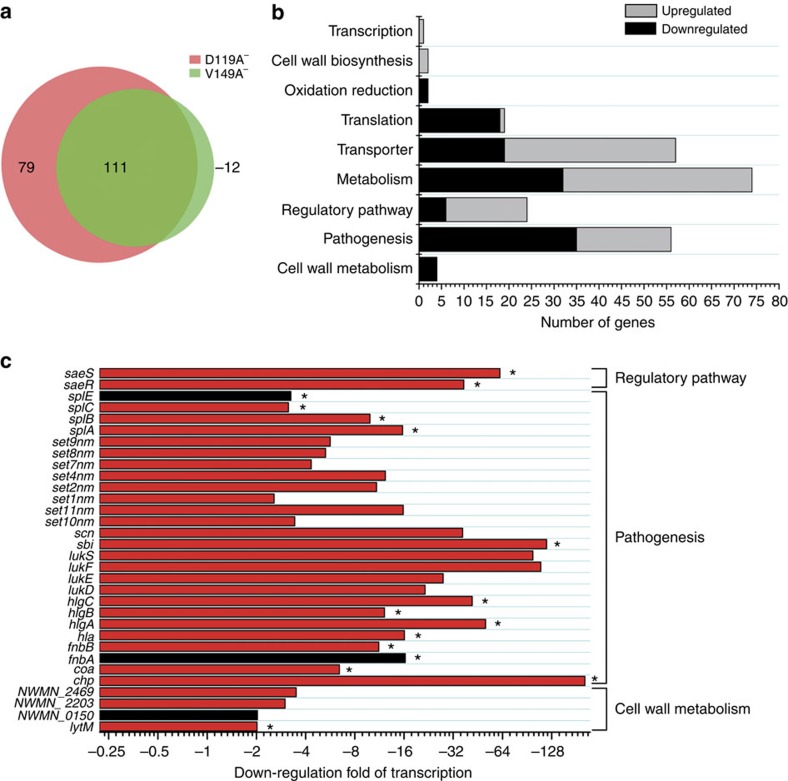
Figure 4. Broad transcription changes were observed in the D119A and V149A mutants.
(a) Venn diagram of the number of genes whose expressions are downregulated in the D119A mutant overlapping genes whose expressions are downregulated in the V149A mutant as compared with the wild-type strain. ‘−': genes whose expressions are downregulated. (b) Grouping genes that are differentially expressed in the D119A mutant compared with the wild-type strain indicated in the diverse roles of WalKR TCS. (c) The majority of downregulated genes are involved in cell wall metabolism, pathogenesis and regulation in the D119A mutant, which is consistent with genes whose expressions were upregulated in the WalRD55E mutant as compared with the wild-type strain.*: genes that exist in both lists. Black bars represent genes that are absent in the transcriptional profiling list of the V149A mutant, while red bars represent genes that are present in the transcriptional profiling list of the V149A mutant.

