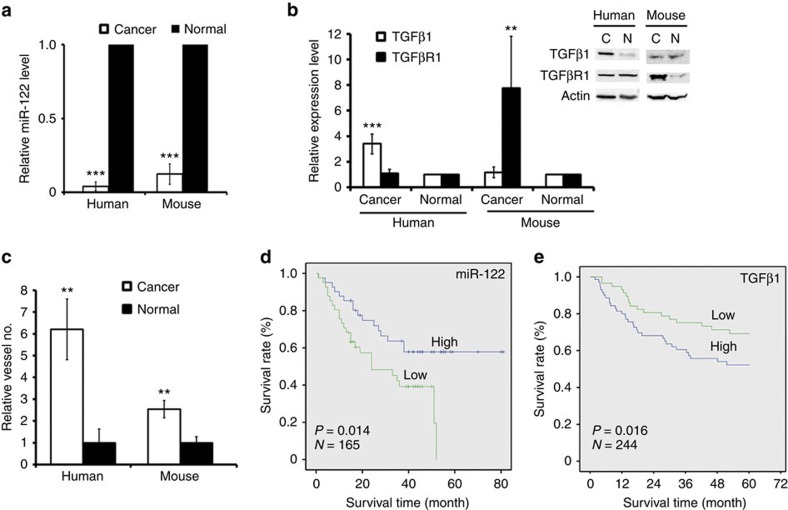
Figure 6. Loss of miR-122 resulted in the different metastatic effects in humans or mice liver cancers in vivo.
(a) Quantitative analysis of miR-122 levels in hepatocellular tumours in HBx gene knock-in transgenic mice or normal liver tissue (eight independent repeats) as well as human hepatocellular tumour tissues or normal adjacent tissue (six independent repeats). (b) Western blot assay showing the expression levels of TGFβ1/TGFβR1 in tissues, as indicated. Representative images are shown in the inset. Eleven independent repeats are performed in each experiment. (c) Quantitative analysis of vessel numbers in the indicated tissues by CD31 staining. (d) Kaplan–Meier curves for overall survival in HCC cohorts from the Liver Cancer Institute (LCI) and Zhongshan Hospital. Expression value=log2 of Robust multi-array analysis (RMA)-calculated signal intensity. miR-122 expression value>0.39 was designed as the high expression group, while miR-122 expression value<-0.58 was designed as the low expression group. n=165 patients; P value based on the Mantel–Cox log-rank test. (e) Kaplan–Meier curves for overall survival in HCC cohorts from the LCI and Zhongshan Hospital. Expression value=log2 of RMA-calculated signal intensity. TGFβ1 expression value <4 was designed as the low expression group, while TGFβ1 expression value>5 was designed as the high expression group. n=244 patients; P value based on the Mantel–Cox log-rank test. Error bars, ±s.d. **P<0.01; ***P<0.001 by two-sided Student's t-test. ND, no difference.

