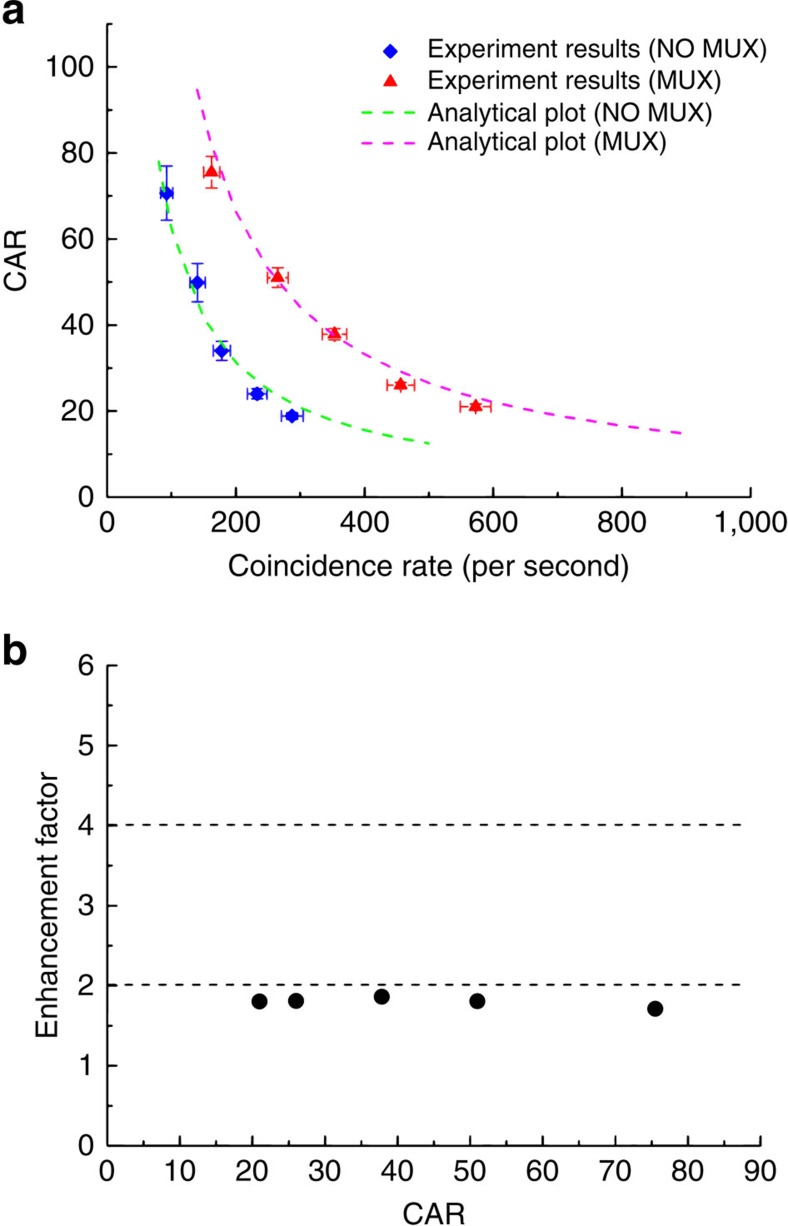
Figure 3. Comparison between sources with and without multiplexing.
(a) CAR as a function of coincidence rates. Poisson error bars are used for the plots. Dashed lines are analytic plots using the model in ref. 25. (b) The inferred enhancement factors to the heralded single-photon output probability at each CAR level.

