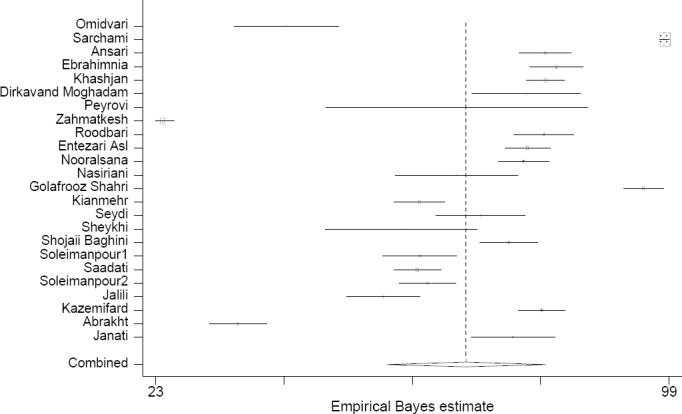
Figure 2.

Distribution of the adjusted percent of patient satisfaction in each study and overall; This chart shows that the range of patient satisfaction percent in each study is 24.04-98.39% before removing outlier data, pooled estimate: 68.9% (57.2-80.7), I2=99.7%
