Figure 2.

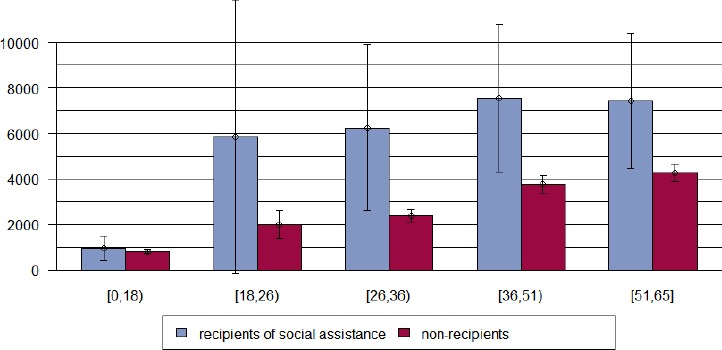
Mean total health care costs (Swiss Francs) and age group for females receiving social assistance versus non-recipients in Bern, Switzerland, year 2012

Mean total health care costs (Swiss Francs) and age group for females receiving social assistance versus non-recipients in Bern, Switzerland, year 2012