FIGURE 1.

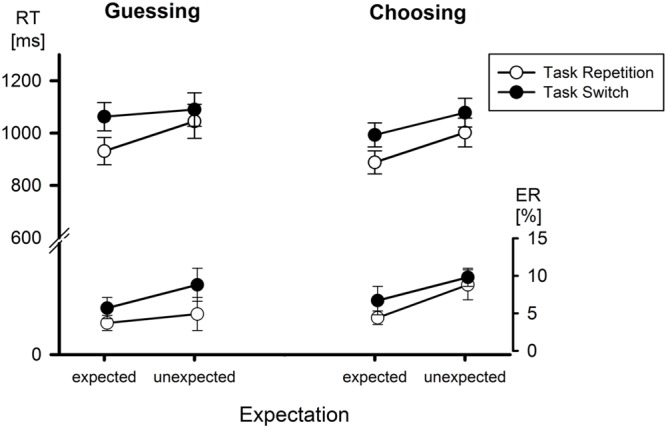
Mean reaction times (RT) and error rates (ER) as a function of Condition, Expectation, and Task Transition. Error bars represent SEM.

Mean reaction times (RT) and error rates (ER) as a function of Condition, Expectation, and Task Transition. Error bars represent SEM.