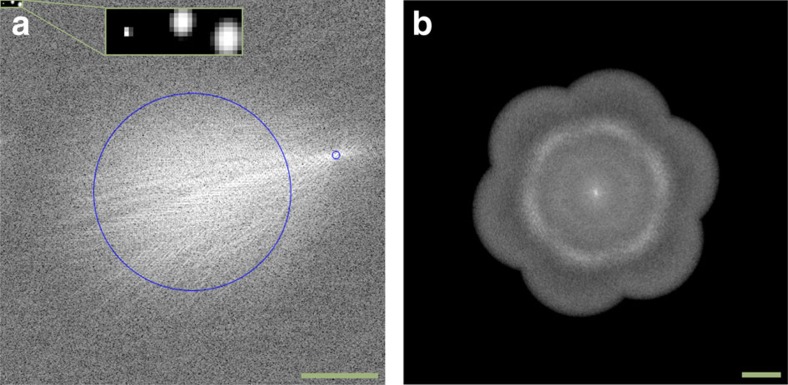
Figure 1. Examples for intermediate SR-SIM results displayed as power spectra in frequency space.
(a) Visualization of the cross-correlation used for parameter estimation, with circles marking the low-frequency region excluded from the fit and the detected modulation frequency. The three insets on the upper left visualize the iterative sub-pixel fits and provide a quick feedback if the fit was successful. (b) Power spectrum of the complete, reassembled SR-SIM reconstruction of fluorescent beads (Fig. 3). The circular structure visible in the spectrum is located at ∼4.5 μm−1, which coincides with the beads' size of 200 nm, and is thus expected. Scale bar, 2.5 μm−1.

