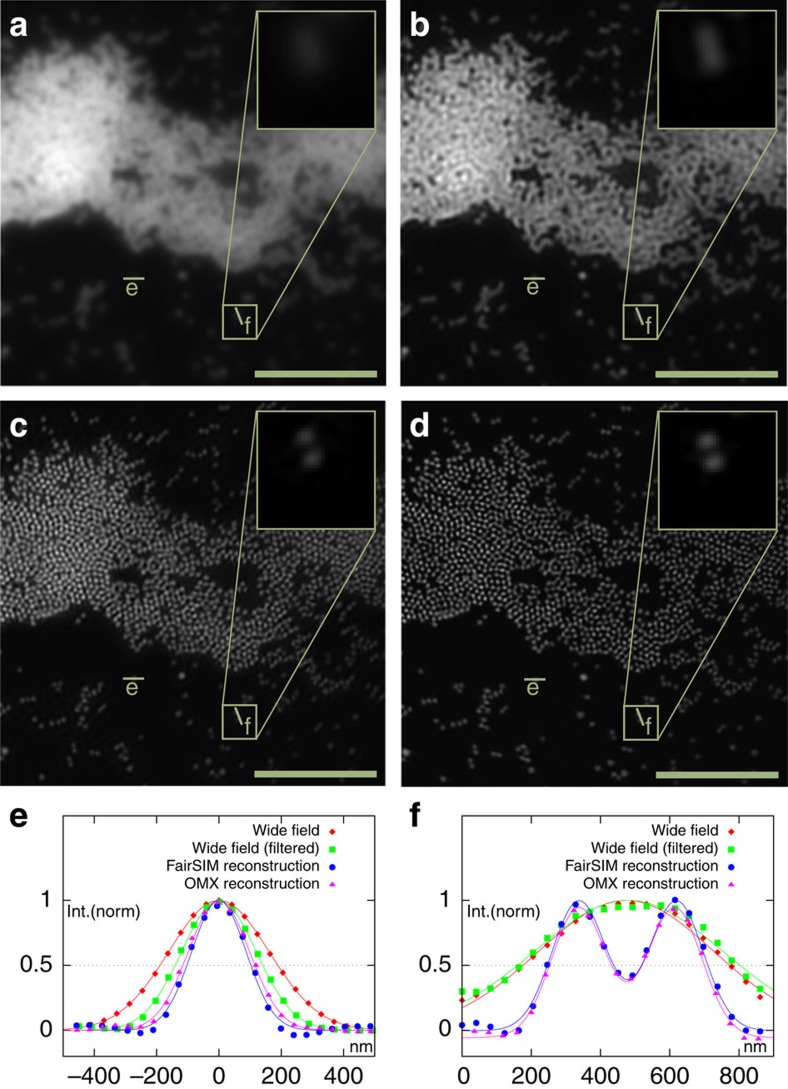
Figure 3. FairSIM reconstruction of data sets obtained on the GE Healthcare DeltaVision|OMX.
A glass surface with 200 nm Tetraspeck beads was used as a test sample, excitated at 642 nm wavelength. In contrast to the wide-field image (a) and its Wiener-filtered version (b), the 2D reconstruction by fairSIM (c) yields clearly distinct beads. The 3D SR-SIM reconstruction by SoftWORX (manufacturer's software) is provided in d for comparison. Please note that the 3D reconstruction is based on a larger amount of input data (complete z-stack), thus resulting in an improved signal-to-noise ratio. A quantitative comparison between all four images can be found as cross-section plots for a single bead in e and for two adjacent beads (indistinguishable in wide-field mode) in f. Scale bar, 5 μm, inset 1.2 μm.

