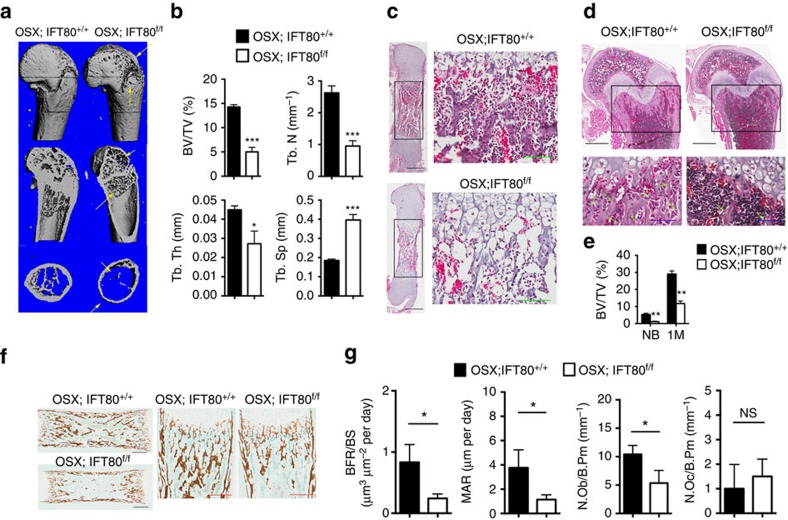
Figure 1. Deletion of IFT80 causes a significant growth retardation and osteopenia.
(a) Micro-CT of the femurs from 1-month-old OSX; IFT80+/+ mice and OSX;IFT80f/f mice. Yellow arrows indicate the bone defects. (b) Quantitative analysis of the percentage of bone volume to total bone volume (BV/TV), trabecular thickness (Tb.Th), trabecular number (Tb.N), and trabecular spacing (Tb.Sp) in the femurs of 1-month-old OSX; IFT80+/+ mice and OSX;IFT80f/f mice (n=4 mice per group). (c) Histological H&E staining analysis of newborn mice tibia. Right panel shows higher magnification of trabecular bone area. Scale bars, 500 μm (left, black) or 100 μm (right, green) (d) Histological H&E staining analysis of 1-month mice tibia. Lower panel shows higher magnification of trabecular bone area. Scale bars, 500 μm (top, black) or 100 μm (bottom, blue) (e) Quantitative analysis of the percentage of bone area to total bone marrow space in tibia (black rectangle) of OSX; IFT80+/+ mice and OSX;IFT80f/f mice shown in c,d (n=4 mice per group). (f) Von Kossa staining of newborn mice tibia. Scale bars, 500 μm (left, black) or 200 μm (right, red). (g) Quantification of mineral apposition rate per bone surface (MAR/BS), bone formation rate (BFR), OB number per bone perimeter (Ob.N/B.Pm) and osteoclast number per bone perimeter (Oc.N/B.Pm) from double calcein injection experiment (n=3 mice per group). Error bars, s.e.m.; *P<0.05, **P<0.01 and ***P<0.0001 as determined by Student's t-test. NS, not statistically significant.

