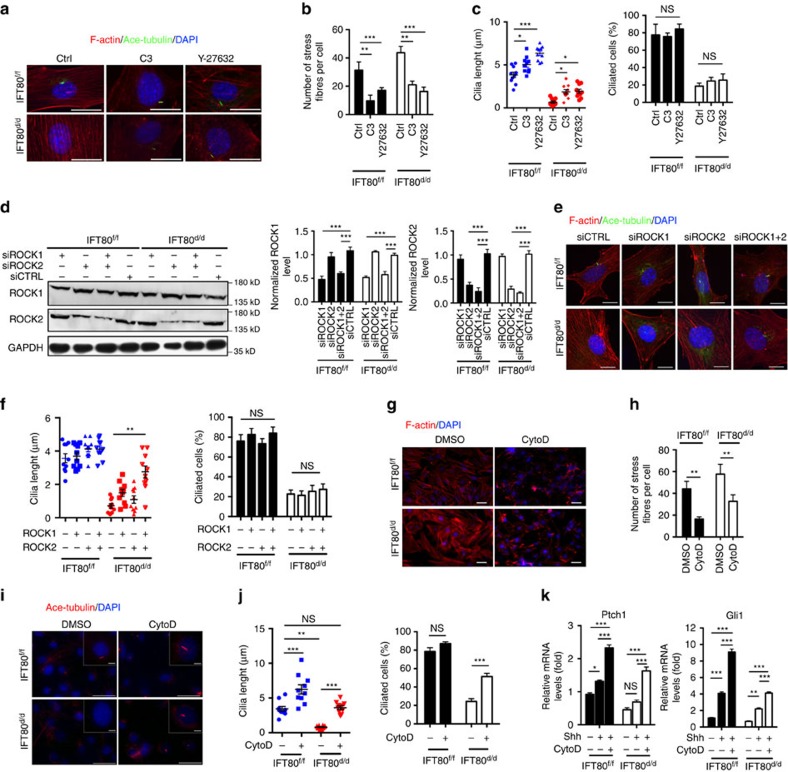
Figure 6. Inhibition of non-canonical Hh signalling reduces stress fibre density while promotes ciliogenesis.
(a) IFT80f/f and IFT80d/d OPCs were stained for actin (red) and cilia (green) after C3 (RhoA inhibitor) or Y-27632 (ROCK inhibitor) treatment. DAPI staining is used as counterstaining. Scale bars, 25 μm. (b) Graph quantifying the percentage of stress fibres shown in a (n=3 with at least 15 cells analysed). (c) Calculated cilia length (n=10 cells) and cilia percentage (n=3 with at least 200 cells analysed) shown in a. (d) Western blot results showing ROCK1 and ROCK2 expression in IFT80f/f and IFT80d/d OPCs after transfected with control siRNA (siCTRL) or siRNA targeting ROCK1, siROCK2 or both. The level of ROCK1 and ROCK2 expression are normalized to GAPDH (n=3). (e) IFT80f/f and IFT80d/d OPCs were stained with stress fibre (red), cilia (green) and the nucleus (blue) after transfected with control siRNA (siCTRL) or siRNA targeting ROCK1, siROCK2 or both. Scale bars, 25 μm. (f) Calculated cilia length (n=10 cells) and cilia percentage (n=3 with at least 200 cells analysed) shown in e. (g) IFT80f/f and IFT80d/d OPCs were stained for actin (red) after CytoD treatment. DAPI staining is used as counterstaining. Scale bars, 100 μm. (h) Graph quantifying the number of stress fibres shown in g (n=3 with at least 15 cells analysed). (i) Immunofluorescence analysis of cilia (acetylated α-tubulin, red) in IFT80f/f and IFT80d/d OPCs with or without CytoD treatment. The insets show a high-power image of cilia. DAPI staining was used as counterstaining. Scale bars, 50 μm. (j) Calculated cilia length (n=3 with at least 10 cells measured) and ciliated cell percentage (n=3 with at least 200 cells analysed) shown in i. (k) QPCR showing Gli1 and Ptch1 expression in IFT80f/f and IFT80d/d OPCs with CytoD and Shh treatment (n=4, triplicates per group). Data points indicate the means, while error bars represent s.e.m. Data were analysed using two-way ANOVA followed by Tukey's multiple comparison test. *P<0.05, **P<0.01, ***P<0.0001. NS, not statistically significant.

