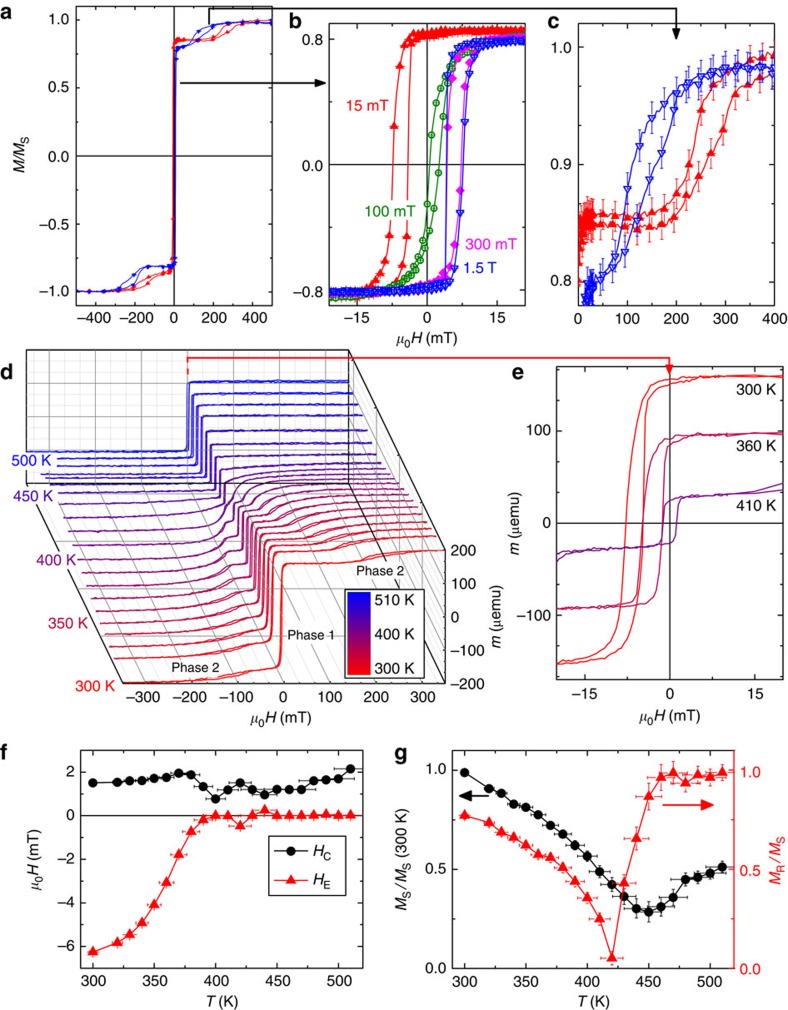
Figure 1. Magnetometry results for sample A (Gd0.42Fe0.58/NiCoO).
(a) Room-temperature hysteresis loops under different cooling fields. (b,c) Zoomed-in views of phase 1 and phase 2, respectively, as indicated by arrows. The colored loops in a–c correspond to cooling fields of 15 mT (red), 100 mT (green), 300 mT (pink), and 1.5 T (blue). Temperature-dependent (d) hysteresis loop (300–510 K, marked by the scale bar, with a zoomed-in view of the phase 1 loops shown in e), (f) coercivity and bias, and (g) saturation magnetization and squareness are shown after field cooling in 15 mT. Error bars are determined by the machine sensitivity limits. For clarity, not all data points are shown.

