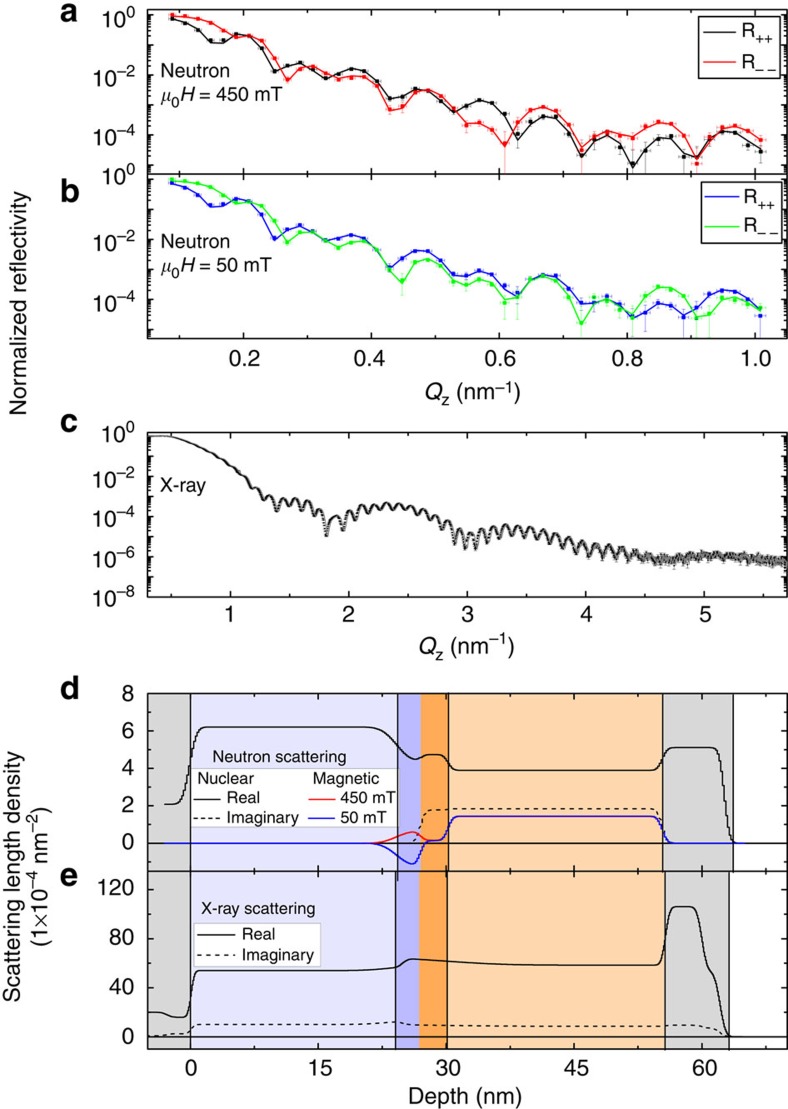
Figure 4. Magnetic and structural depth profiles.
PNR data (symbols) and fitted reflectometry (lines) for sample A (x=0.42) in a (a) 450- and (b) 50-mT field applied parallel to the cooling field; (c) X-ray reflectometry data (symbols) and fitted reflectometry (line) of sample A. (d) The fitted profile determined from PNR with the real (solid) and imaginary (dashed) nuclear structure shown in black and magnetic depth profile in blue (50 mT) and red (450 mT); the structural profile from X-ray reflectivity (XRR) is shown in e. For d and e, the film structure from the left to right, at increasing depth, corresponds to the Si substrate (grey), NiCoO (light blue), interfacial NiCo (dark blue), interfacial GdFe/GdOy (peach), GdFe (brown), Ta cap (grey) and air (white). Error bars in Qz identify machine precision; error bars in normalized reflectivity are defined by the s.d. and scales with the square root of the number of measurements.

