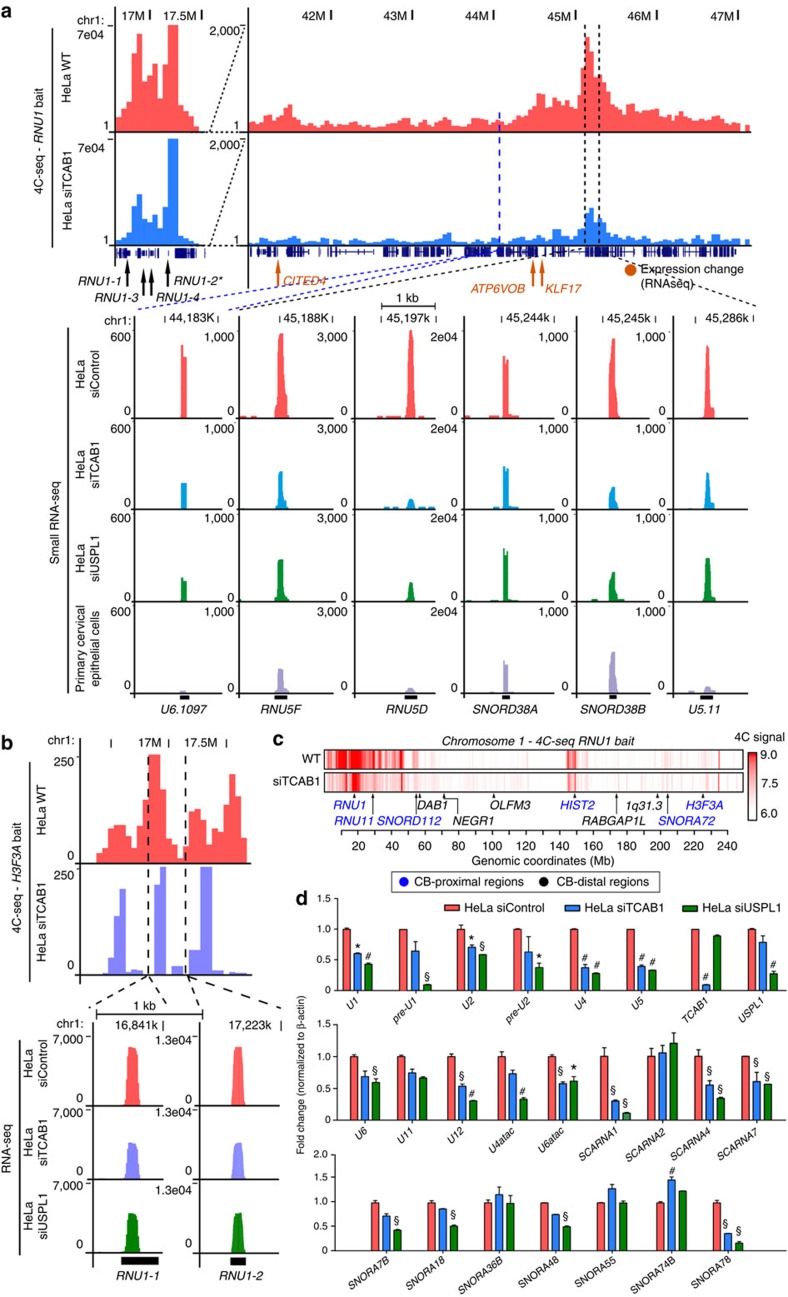
Figure 2. Chromosome 1 undergoes a substantial topological rearrangement following Cajal body disassembly.
(a) Representative 4C-seq contact profile of intra-chromosomal, CB-dependent interactions using a RNU1 bait sequence for siControl (HeLa WT, pink) and siTCAB1 (TCAB1kd, blue) treatments. A number of expressed U genes were enriched within this region (dotted lines), which were determined to decrease following siTCAB1 and siUSPL1 (green) treatment by small RNA-seq. The expression of these genes within human primary cervical epithelial cells is also shown (purple). The bait region is depicted between 16.5 and 17.5 MBp (RNU1-2*). Several genes of interest were also located in this region, denoted by arrows (orange=RNA-seq expression change following TCAB1 or USPL1 knockdown). The y-axis displays the sequencing read counts/genome fragment, (b) representative 4C-seq contact profile of H3F3A bait to the RNU1 array region on chromosome 1 in control (pink) and siTCAB1-treated (blue) in HeLa cells. RNA-seq expression profile of RNU1-1 and RNU1-2 loci within this genomic region (dotted lines) show a sensitivity of these U genes to CB disruption by TCAB1kd or USPL1kd (green) by small RNA-seq. y-axis displays the read counts/genome fragment, (c) chromosome 1 RNU1 4C-seq physical contact profile (red, log10 scale) in HeLa cells under normal conditions (WT) following CB disassembly using TCAB1 siRNA. Locations of CB-proximal (blue) and -distal regions (black) used for selection of BAC probes are also indicated. (d) Validation of U RNA gene and small nucleolar RNA (SNORD/SNORA/SCARNA) expression changes in HeLa cells following siControl, siTCAB1 or siUSPL1 treatment normalized to β-actin (as depicted). n=2, *P<0.05, #P<0.01, §P<0.001 compared with HeLa siControl, significance was assessed by Student's t-test. Error bars represent s.e.m.

