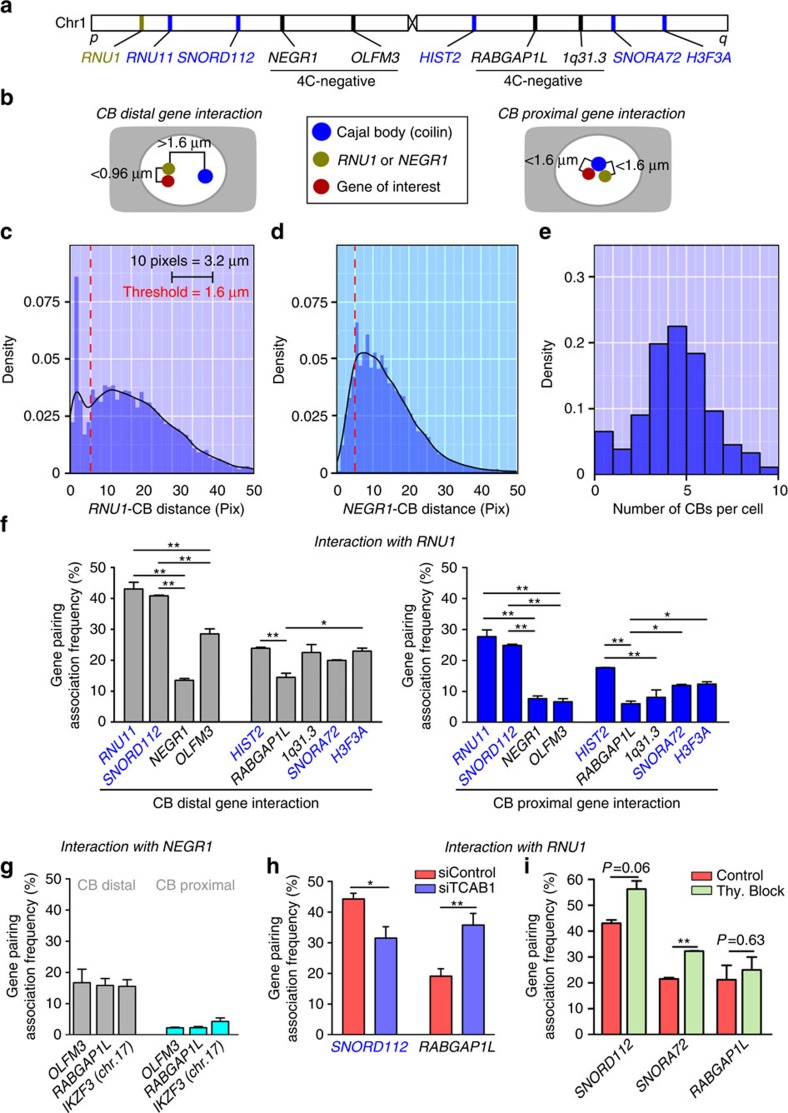
Figure 4. High-content microscopic validation of Cajal body-dependent gene interactions.
(a) Approximate chromosomal location of BAC DNA FISH probe target sequences used in automated high-throughput DNA FISH-IF co-localization studies. Blue text denotes CB-interacting (4C-positive) loci. Regions determined to be non-CB interacting are denoted by (4C-negative, black text). (b) A schematic detailing the threshold criteria used to determine whether a gene–gene cis-interaction or gene–CB interaction was meaningful. The RNU1 gene and various gene locus of interest located on chromosome 1 were determined to interact in the absence of CBs when distance was >5 pixels from a CB, but ≤3 pixels between spot centres (CB-independent). CB-clustered gene loci were determined to occur within a distance of ≤5 pixels between the CB spot centre and the RNU1 loci spot centre (CB-dependent). Red spot=RNU1, green=variable gene of interest, purple=CB. (c) Histogram of the per-RNU1 FISH spot minimum distances between RNU1 and CB (in pixels, 10 pixels=3.2 μm). Blue bars=binned data, black line=estimated density function, red dotted line=threshold criteria (1.6 μm). (d) Histogram of the per-CB spot minimum distances between NEGR1 and CB (in pixels, 10 pixels=3.2 μm). Blue bars=binned data, black line=estimated density function, red dotted line=threshold criteria (1.6 μm). (e) Histogram depicting the number of CBs per cell in HeLa cells as quantified by high-throughput imaging (>1,000 cells). (f) Association frequency between RNU1 and various genes of interest on chromosome 1 (plotted in order relative to RNU1) as determined by automated high-throughput imaging. Interactions were grouped according to the criteria detailed in b. (g) Comparisons were also made between sn/snoRNA-poor loci. Total gene pairing was also assessed after (h) siTCAB1 treatment and (i) cell cycle arrest by double-thymidine treatment (Thy. Block). n=2 (>1,000 cells per replicate), error bars depict s.e.m., *P<0.05, **P<0.01, ***P<0.001 versus RNU1-NEGR1 or RNU1-RABGAP1L was assessed by Student's t-test. Error bars represent s.e.m. CB-distal interactions=grey, CB-dependent interactions=dark blue. Red=siControl, blue=siTCAB1, light green=double-thymidine block.

