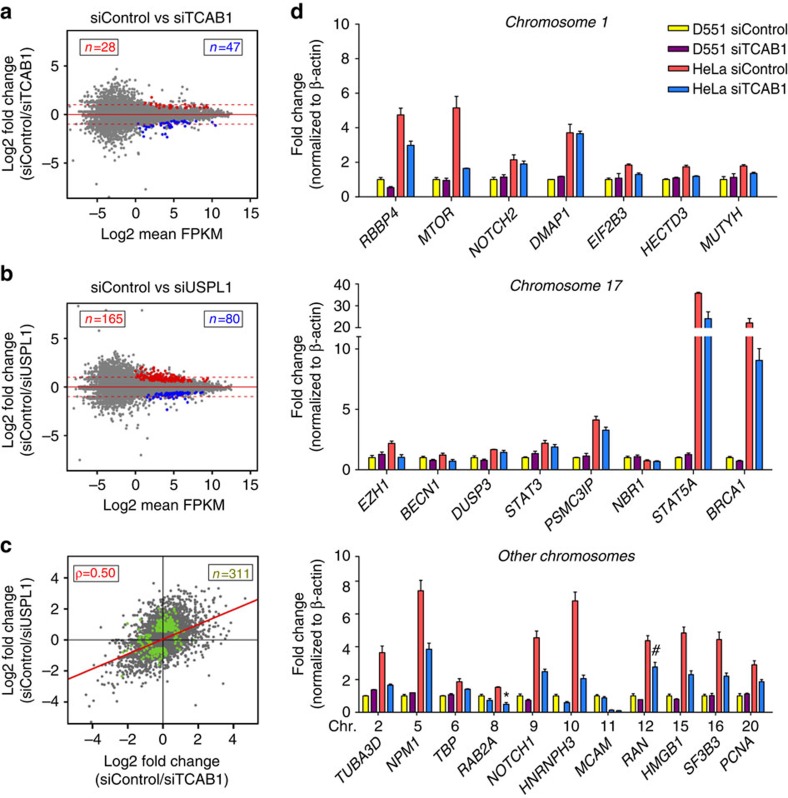
Figure 5. Differential gene-level transcription and splicing following Cajal body disruption.
(a,b) Ratio versus mean abundance scatterplots for the siTCAB1 (a) and USPL1 (b) treatments. Coloured dots represent gene differentially expressed (at FDR-adjusted P value<0.01, red=higher in siControl, blue=higher in knockdown). (c) Ratio/Ratio scatterplot of fold-change differences in either siUSPL1 or siTCAB1 treatments. Dots in green have adjusted P value<0.01 in either comparison. Dots in the lower left and upper right quadrants indicate fold changes in the same direction. (d) Validation of a selection of genes within 4C contact regions by qRT–PCR normalized to β-actin (yellow=primary D551 cells, red=HeLa siControl, blue=HeLa siTCAB1). n=2, *P<0.05, #P<0.01, §P<0.001 compared with HeLa siControl, significance was assessed by Student's t-test. Error bars represent s.e.m.

