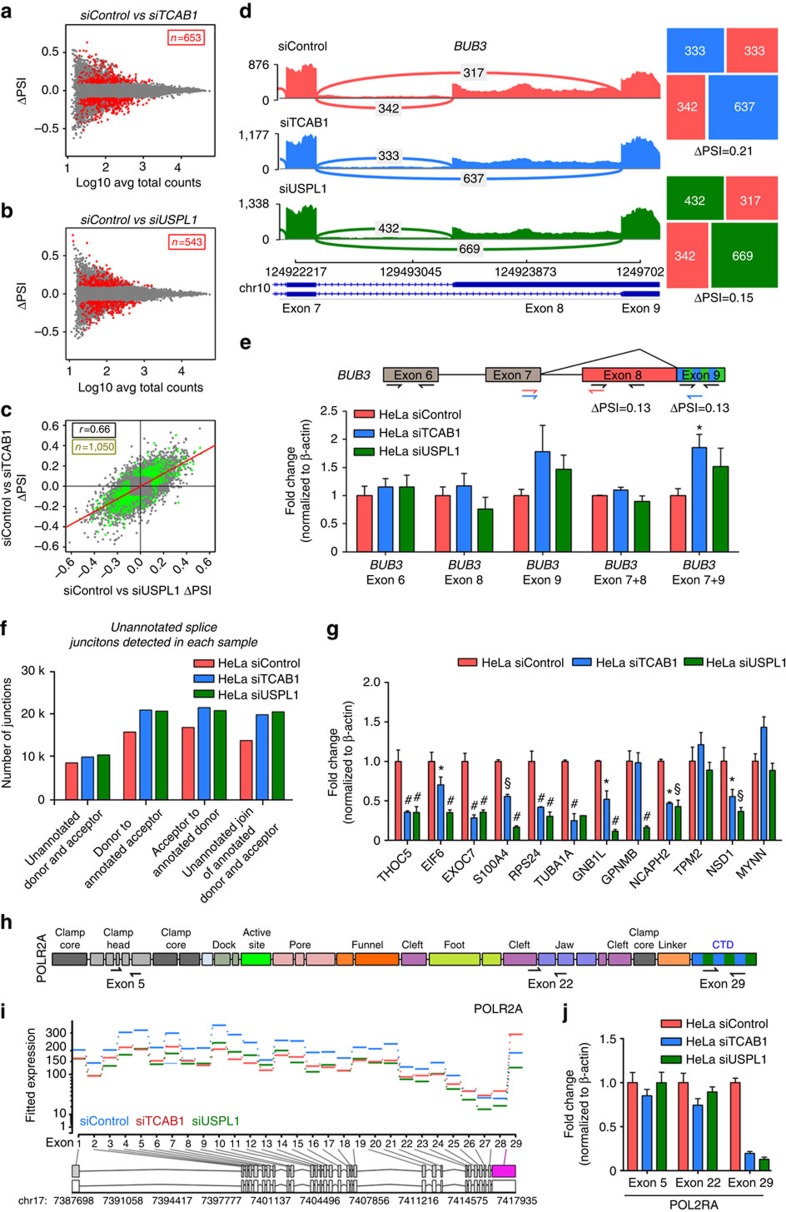
Figure 6. CB depletion increases unannotated RNA splicing including RNA polymerase II CTD deletion.
(a,b) Difference in percentage spliced in (Delta PSI) versus mean abundance (log10 average total read counts) scatterplots for siTCAB1 (a) and siUSPL1 (b) treatments. Coloured dots represent local pairwise splicing events that are differentially spliced (at FDR-adjusted P value<0.01, red=higher in siControl, blue=higher in knockdown). (c) Delta PSI/Delta PSI scatterplot of splicing differences in siUSPL1 or siTCAB1 treatments. Dots in green have adjusted P value=0.01 in either comparison. Dots in the lower left and upper right quadrants indicate fold changes in the same direction. (d) Sashimi plot of RNA-seq coverage over exons and junctions in the BUB3 locus. Differential splicing of an alternative acceptor is indicated. Squares are mosaic plots of splice junction counts within this splicing event. (e) Validation of alternative splicing of BUB3 detected by DEXseq through qRT–PCR in HeLa cells treated with siControl (red), siTCAB1 (blue) or siUSPL1 (green). Primers detected exon 6, 8, 9, 7+8 or/and +9 (as depicted). n=2, significance was assessed by Student's t-test. Error bars represent s.e.m. (f) Distribution of splice junctions detected in HeLa cells exposed to siControl, siTCAB1 or siUSPL1 (blue, red and green, respectively). (g) Validation of alternative splicing of a selection of genes detected by DEXseq through qRT–PCR in HeLa cells treated with siControl (red), siTCAB1 (blue) or siUSPL1 (green). n=2, *P<0.05, #P<0.01, §P<0.001 compared with HeLa siControl, significance was assessed by Student's t-test. Error bars represent s.e.m. (h) Location of primer sequences recognizing exons 5, 22 (both non-CTD) and 29 (CTD tail) within the gene encoding the largest subunit of RNA polymerase II (POL2RA), which were used to validate a previously unannotated alternative splicing mechanism for POL2RA. (i) DEXseq results for the POL2RA locus, indicating significant differential expression of exon 29, encoding the CTD tail under TCAB1 (blue) or USPL1 (green) knock-down conditions. (j) Validation of differential exon usage of POL2RA detected by DEXseq through qRT–PCR, using primers briefly detailed in h, in HeLa cells treated with siControl (red), siTCAB1 (blue) or siUSPL1 (green). n=2, error bars represent s.e.m.

