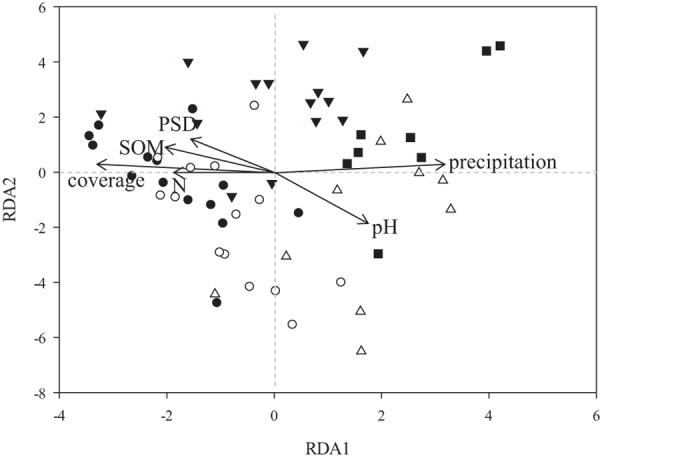
Figure 3.

Redundancy Analysis (RDA) plot of AMF community composition in rhizosphere of three plant species and vectors of significant (P < 0.05) environmental variables across sites. The first and second axes explain 20.69% and 4.19% of the variance, respectively. •, Ł, ▾, ▵ and ▄ represent the sampling sites BG, NM, ZC, GZ and GG, respectively.
