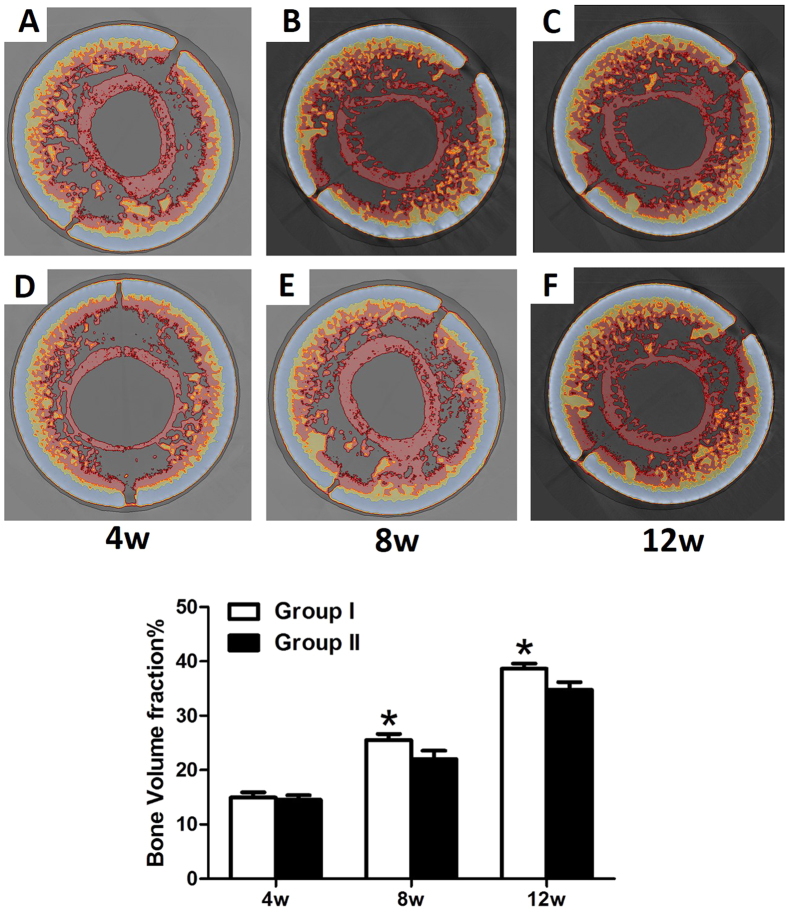
Figure 11.
Cross section of the micro-CT images of the osteo-regenerators at 4 weeks (A,D), 8 weeks (B,E) and 12 weeks (C,F) post-operation in group I (A–C) and group II (D–F). (G) Results of the quantitative analyses at different time points post-operation. (asterisks (*) indicate statistical significance. P < 0.05).

