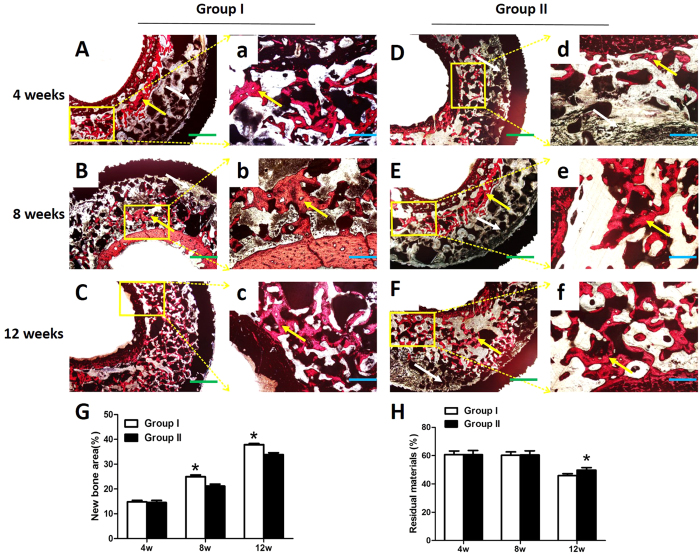
Figure 12.
(A–F,a-f) Van Gieson staining of histological sections and (G,E) quantitative analysis of the new bone and residual material in the osteo-regenerators at 4, 8 and 12 weeks post-operation. The yellow arrow indicates newly formed bone. The connective tissue is marked by a white arrow. Asterisks (*) indicate statistical significance, P < 0.05. Scale bar: 50 μm (blue), 20 μm (green).

